![]()
|
|
|
|
OPC 10000-13 |
|
|
OPC Unified Architecture Part 13: Aggregates
Release 1.05.02 2022-11-01
|


![]()
|
|
|
|
OPC 10000-13 |
|
|
OPC Unified Architecture Part 13: Aggregates
Release 1.05.02 2022-11-01
|
|
Specification Type |
Industry Standard Specification |
|
|
|
|
|
|
|
|
|
|
|
|
|
Document |
OPC 10000-13 |
|
|
|
Title: |
OPC Unified Architecture |
Date: |
2022-11-01 |
|
|
|
|
|
|
Version: |
Release 1.05.02 |
Software |
MS-Word |
|
|
|
Source: |
OPC 10000-13 - UA Specification Part 13 - Aggregates 1.05.02.docx |
|
|
|
|
|
|
Author: |
OPC FOUNDATION |
Status: |
Release |
|
|
|
|
|
The official PDF release of this document will contain a digital signature from the OPC Foundation in the following box:
|
|
CONTENTS
3 Terms, definitions, and abbreviated terms
4.2.2 AggregateFunction Object
4.3 MonitoredItem AggregateFilter
4.3.1 MonitoredItem AggregateFilter Defaults
4.3.2 MonitoredItem Aggregates and Bounding Values
4.4 Exposing Supported Functions and Capabilities
5 Aggregate specific usage of Services
5.2.2 ReadProcessedDetails structure overview
5.2.3 AggregateFilter structure overview
5.3.2 Operation level result codes
5.3.3 Aggregate Information Bits
5.4.3 Specific aggregated data handling
Figure 1 – Representation of Aggregate Configuration information in the AddressSpace....... 9
Figure 2 – Variable with Stepped = False and Simple Bounding Values........................... 16
Figure 3 – Variable with Stepped = True and Interpolated Bounding Values..................... 17
Table 13 – Standard History Aggregate Data Type information..................................... 14
Table 23 – MinimumActualTime Aggregate summary.................................................. 25
Table 24 – MaximumActualTime Aggregate summary................................................. 26
Table 28 – MinimumActualTime2 Aggregate summary................................................ 29
Table 29 – MaximumActualTime2 Aggregate summary............................................... 30
Table 34 – DurationInStateNonZero Aggregate summary............................................ 33
Table 35 – NumberOfTransitions Aggregate summary................................................ 34
Table 48 – StandardDeviationSample Aggregate summary.......................................... 42
Table 50 – StandardDeviationPopulation Aggregate summary...................................... 44
____________
UNIFIED ARCHITECTURE –
This specification is the specification for developers of OPC UA applications. The specification is a result of an analysis and design process to develop a standard interface to facilitate the development of applications by multiple vendors that shall inter-operate seamlessly together.
Copyright © 2006-2022, OPC Foundation, Inc.
COPYRIGHT RESTRICTIONS
Any unauthorized use of this specification may violate copyright laws, trademark laws, and communications regulations and statutes. This document contains information which is protected by copyright. All Rights Reserved. No part of this work covered by copyright herein may be reproduced or used in any form or by any means--graphic, electronic, or mechanical, including photocopying, recording, taping, or information storage and retrieval systems--without permission of the copyright owner.
OPC Foundation members and non-members are prohibited
from copying and redistributing this specification. All copies must be obtained
on an individual basis, directly from the OPC Foundation Web site
https://opcfoundation.org.
PATENTS
The attention of adopters is directed to the possibility that compliance with or adoption of OPC specifications may require use of an invention covered by patent rights. OPC shall not be responsible for identifying patents for which a license may be required by any OPC specification, or for conducting legal inquiries into the legal validity or scope of those patents that are brought to its attention. OPC specifications are prospective and advisory only. Prospective users are responsible for protecting themselves against liability for infringement of patents.
WARRANTY AND LIABILITY DISCLAIMERS
WHILE THIS PUBLICATION IS BELIEVED TO BE ACCURATE, IT IS PROVIDED "AS IS" AND MAY CONTAIN ERRORS OR MISPRINTS. THE OPC FOUDATION MAKES NO WARRANTY OF ANY KIND, EXPRESSED OR IMPLIED, WITH REGARD TO THIS PUBLICATION, INCLUDING BUT NOT LIMITED TO ANY WARRANTY OF TITLE OR OWNERSHIP, IMPLIED WARRANTY OF MERCHANTABILITY OR WARRANTY OF FITNESS FOR A PARTICULAR PURPOSE OR USE. IN NO EVENT SHALL THE OPC FOUNDATION BE LIABLE FOR ERRORS CONTAINED HEREIN OR FOR DIRECT, INDIRECT, INCIDENTAL, SPECIAL, CONSEQUENTIAL, RELIANCE OR COVER DAMAGES, INCLUDING LOSS OF PROFITS, REVENUE, DATA OR USE, INCURRED BY ANY USER OR ANY THIRD PARTY IN CONNECTION WITH THE FURNISHING, PERFORMANCE, OR USE OF THIS MATERIAL, EVEN IF ADVISED OF THE POSSIBILITY OF SUCH DAMAGES.
The entire risk as to the quality and performance of software developed using this specification is borne by you.
RESTRICTED RIGHTS LEGEND
This Specification is provided with Restricted Rights. Use, duplication or disclosure by the U.S. government is subject to restrictions as set forth in (a) this Agreement pursuant to DFARs 227.7202-3(a); (b) subparagraph (c)(1)(i) of the Rights in Technical Data and Computer Software clause at DFARs 252.227-7013; or (c) the Commercial Computer Software Restricted Rights clause at FAR 52.227-19 subdivision (c)(1) and (2), as applicable. Contractor / manufacturer are the OPC Foundation, 16101 N. 82nd Street, Suite 3B, Scottsdale, AZ, 85260-1830.
COMPLIANCE
The OPC Foundation shall at all times be the sole entity that may authorize developers, suppliers and sellers of hardware and software to use certification marks, trademarks or other special designations to indicate compliance with these materials. Products developed using this specification may claim compliance or conformance with this specification if and only if the software satisfactorily meets the certification requirements set by the OPC Foundation. Products that do not meet these requirements may claim only that the product was based on this specification and must not claim compliance or conformance with this specification.
Trademarks
Most computer and software brand names have trademarks or registered trademarks. The individual trademarks have not been listed here.
GENERAL PROVISIONS
Should any provision of this Agreement be held to be void, invalid, unenforceable or illegal by a court, the validity and enforceability of the other provisions shall not be affected thereby.
This Agreement shall be governed by and construed under the laws of the State of Minnesota, excluding its choice or law rules.
This Agreement embodies the entire understanding between the parties with respect to, and supersedes any prior understanding or agreement (oral or written) relating to, this specification.
ISSUE REPORTING
The OPC Foundation strives to maintain the highest quality standards for its published specifications, hence they undergo constant review and refinement. Readers are encouraged to report any issues and view any existing errata here: https://opcfoundation.org/developer-tools/specifications-unified-architecture/errata/.
Revision 1.05.02 Highlights
The following table includes the Mantis issues resolved with this revision.
|
Mantis ID |
Scope |
Summary |
Resolution |
|
Errata |
Aggregate start, end Delta wording |
The Raw status bit is always be set for non-bad StatusCodes for the Start and End aggregates. |
|
|
Errata |
Inconsistency for Aggregate Interpolative between description and Sample Historian |
Entries in the Interpolative examples Tables A2.2 Hisotorian1, Historian2, and Historian3 have been changed from Good to Good, Raw status codes when the timestamp matches with the timestamp of the data source. |
|
|
Errata |
Sample Data missing for DurationInStateZero and DurationInStateNonZero |
Missing tables were added for DurationInStateZero and DurationInStateNonZero. |
|
|
Errata |
Wrong Data in Sample Historian for Aggregate Delta |
The value of zero has been removed for reslts with a StatusCode of bad. |
|
|
Errata |
Wrong DataType for StandardDeviationSample and following aggregates |
Data Type was listed as "Status Code" when it should be "Double" for both Standard Deviation and both Variance Aggregates. |
|
|
Errata |
Wrong Values in Sample Historian_2 and Historian_3 for TimeAverage, in Sample Historian_2 for TimeAverage2 |
Rounding Error in TimeAverage and TimeAverage2 have been corrected. |
|
|
Errata |
Wrong statusCode in Sample Historian_3 for TimeAverage |
The status codes have been corrected for the last two intervals and the value has been corrected in the last interval. |
|
|
Errata |
Clarification about setting MultipleValues bit in WorstQuality2 |
The wording has been changed to be more consistent with the certification testing tool. |
|
|
Errata |
Example Aggregate data – Historian 2 UseSlopedExtrapolation should be set to true |
UsedSlopedExtrapolation set to true for Historian2 and all examples locations needed new values or status' are modified. |
|
|
Errata |
Count and other aggregates data Hisorian3 requires update |
Values affected by percent good and percent bad have been updated. |
|
|
Errata |
NumberOfTransitions data Historian3 Data requires update |
PercentGood/PercentBad are now accounted for in the calculation. |
|
|
Errata |
Clarification about sample data Historian_3 in Total |
TimeAverage must use SlopedInterpolation but the Time aggregate is incorrectly allowed to used Stepped Interpolation. |
|
|
Errata |
Partial Bit not being set for Interpolated Aggregates TimeAverage and Total |
Partial bit is now correctly calculated. |
|
|
Errata |
General - Wording is unclear |
Unclear sentence was removed. |
|
|
Errata |
Create a CSV of all the examples. |
Examples have been moved to a CSV. |
|
|
Errata |
The WorstQuality2 calculation for value and status code is incorrect for the rules defined for Historian 3. |
The value and status code for Historian 3 have been updated. |
|
|
Errata |
TimeAverage2:Historian1 requires updates as per Get Time Weighted Status |
TimeAverage2 Historian1 now takes uncertain regions into account when calculating StatusCodes. |
|
|
Errata |
TimeAverage2:Historian2 requires updates as per Get Time Weighted Status |
TimeAverage2 Historian2 now takes uncertain regions into account when calculating StatusCodes. |
|
|
Errata |
Total2:Historian1 requires updates as per Get Time Weighted Status |
Total2 Historian1 now takes uncertain regions into account when calculating StatusCodes |
|
|
Errata |
Total2:Historian2 requires updates as per Get Time Weighted Status |
Total2 Historian2 now takes uncertain regions into account when calculating StatusCodes |
|
|
Errata |
Maximum2:Historian1 requires updates as per Get Time Weighted Status |
Maximum2 Historian1 now takes uncertain regions into account when calculating StatusCodes |
|
|
Errata |
MaximumActualTime2:Historian1 requires updates as per Get Time Weighted Status |
MaximumActualTime2 Historian1 now takes uncertain regions into account when calculating StatusCodes |
|
|
Errata |
Minimum2:Historian1 requires updates as per Get Time Weighted Status |
Minimum2 Historian1 now takes uncertain regions into account when calculating StatusCodes |
|
|
Errata |
MinimumActualTime2:Historian1 requires updates as per Get Time Weighted Status |
MinimumActualTime2 Historian1 now has the StatusCodes calculated while using the TreatUncertainAsBad flag. |
|
|
Errata |
Range2:Historian1 requires updates as per Get Time Weighted Status |
Range2 Historian1 now looks at TreatUncertainAsBad in the calculation of the StatusCodes. |
|
|
Errata |
Time Based Status Calculations should respect PercentGood/PercentBad equality check. |
Clarifications were made to the text defining how PercentGood/PercentBad are used. The TimeAverage2 and Total2 aggregets had their table values and StatusCodes corrected. |
OPC Unified Architecture Specification
Part 13: Aggregates
This specification is part of the overall OPC Unified Architecture specification series and defines the information model associated with Aggregates.
OPC 10000-1, OPC Unified Architecture - Part 1: Overview and Concepts
http://www.opcfoundation.org/UA/Part1/
OPC 10000-3, OPC Unified Architecture - Part 3: Address Space Model
http://www.opcfoundation.org/UA/Part3/
OPC 10000-4, OPC Unified Architecture - Part 4: Services
http://www.opcfoundation.org/UA/Part4/
OPC 10000-5, OPC Unified Architecture - Part 5: Information Model
http://www.opcfoundation.org/UA/Part5/
OPC 10000-8, OPC Unified Architecture - Part 8: Data Access
http://www.opcfoundation.org/UA/Part8/
OPC 10000-11, OPC Unified Architecture - Part 11: Historical Access
http://www.opcfoundation.org/UA/Part11/
For the purposes of this document, the terms and definitions given in OPC 10000-1, OPC 10000-3, OPC 10000-4, and OPC 10000-11 as well as the following apply.
3.1.1
ProcessingInterval
timespan for which derived values are produced based on a specified Aggregate
Note 1 to entry: The total time domain specified for ReadProcessed is divided by the ProcessingInterval. For example, performing a 10-minute Average over the time range 12:00 to 12:30 would result in a set of three intervals of ProcessingInterval length, with each interval having a start time of 12:00, 12:10 and 12:20 respectively. The rules used to determine the interval Bounds are discussed in 5.4.2.2.
3.1.2
Interpolated data
data that is calculated from data samples
Note 1 to entry: Data samples may be historical data or buffered real time data. An interpolated value is calculated from the data points on either side of the requested timestamp.
3.1.3
EffectiveEndTime
time immediately before endTime
Note 1 to entry: All Aggregate calculations include the startTime but exclude the endTime. However, it is sometimes necessary to return an Interpolated End Bound as the value for an Interval with a timestamp that is in the interval. Servers are expected to use the time immediately before endTime where the time resolution of the Server determines the exact value (do not confuse this with hardware or operating system time resolution). For example, if the endTime is 12:01:00, the time resolution is 1 second, then the EffectiveEndTime is 12:00:59. See 5.4.2.4.
If time is flowing backwards, Servers are expected to use the time immediately after endTime where the time resolution of the Server determines the exact value.
3.1.4
Extrapolated data
data constructed from a discrete data set but is outside of the discrete data set
Note 1 to entry: It is similar to the process of interpolation, which constructs new points between known points, but its result is subject to greater uncertainty. Extrapolated data is used in cases where the requested time period falls farther into the future than the data available in the underlying system. See example in Table 1.
SlopedInterpolation
simple linear interpolation
Note 1 to entry: Compare to curve fitting using linear polynomials. See example in Table 1.
3.1.6
SteppedInterpolation
Interpolation holding the last data point constant or interpolating the value based on a horizontal line fit
Note 1 to entry: Consider the following Table 1 of raw and Interpolated/Extrapolated values:
Table 1 – Interpolation examples
|
Timestamp |
Raw Value |
Sloped Interpolation |
Stepped Interpolation |
|
12:00:00 |
10 |
|
|
|
12:00:05 |
|
15 |
10 |
|
12:00:08 |
|
18 |
10 |
|
12:00:10 |
20 |
|
|
|
12:00:15 |
|
25 |
20 |
|
12:00:20 |
30 |
|
|
|
|
|
SlopedExtrapolation |
SteppedExtrapolation |
|
12:00:25 |
|
35 |
30 |
|
12:00:27 |
|
37 |
30 |
3.1.7
bounding values
values at the startTime and endTime needed for Aggregates to compute the result
Note 1 to entry: If Raw data does not exist at the startTime and endTime a value shall be estimated. There are two ways to determine Bounding Values for an interval. One way (called Interpolated Bounding Values) uses the first non-Bad data points found before and after the timestamp to estimate the bound. The other (called Simple Bounding Values) uses the data points immediately before and after the boundary timestamps to estimate the bound even if these points are Bad. Subclauses 3.1.8 and 3.1.9 describe the two different approaches in more detail.
In all cases the TreatUncertainAsBad (see 4.2.1.2) flag is used to determine whether Uncertain values are Bad or non-Bad.
If a Raw value was not found and a non-Bad bounding value exists the Aggregate Bits (see 5.3.3) are set to ‘Interpolated’.
When calculating bounding values, the value portion of Raw data that has Bad status is set to null. This means the value portion is not used in any calculation and a null is returned if the raw value is returned. The status portion is determined by the rules specified by the bound or Aggregate.
The Interpolated Bounding Values approach (see 3.1.8) is the same as what is used in Classic OPC Historical Data Access (HDA) and is important for applications such as advanced process control where having useful values at all times is important. The Simple Bounding Values approach (see 3.1.9) is new in this standard and is important for applications which shall produce regulatory reports and cannot use estimated values in place of Bad data.
interpolated bounding values
bounding values determined by a calculation using the nearest Good value
Note 1 to entry: Interpolated Bounding Values using SlopedInterpolation are calculated as follows:
· if a non-Bad Raw value exists at the timestamp then it is the bounding value;
· find the first non-Bad Raw value before the timestamp;
· find the first non-Bad Raw value after the timestamp;
· draw a line between before value and after value;
· use point where the line crosses the timestamp as an estimate of the bounding value.
The calculation can be expressed with the following formula:
Vbound = (Tbound – Tbefore)x( Vafter – Vbefore)/( Tafter – Tbefore) + Vbefore
where Vx is a value at ‘x’ and Tx is the timestamp associated with Vx.
If no non-Bad values exist before the timestamp the StatusCode is Bad_NoData. The StatusCode is Uncertain_DataSubNormal if any Bad values exist between the before value and after value. If either the before value or the after value are Uncertain the StatusCode is Uncertain_DataSubNormal. If the after value does not exist the before value shall be extrapolated using SlopedExtrapolation or SteppedExtrapolation.
The period of time that is searched to discover the Good values before and after the timestamp is Server dependent, but if a Good value is not found within some reasonable time range then the Server will assume it does not exist. The Server as a minimum should search a time range which is at least the size of the ProcessingInterval.
Interpolated Bounding Values using SlopedExtrapolation are calculated as follows:
· find the first non-Bad Raw value before timestamp;
· find the second non-Bad Raw value before timestamp;
· draw a line between these two values;
· extend the line to where it crosses the timestamp;
· use the point where the line crosses the timestamp as an estimate of the bounding value.
The formula is the same as the one used for SlopedInterpolation.
The StatusCode is always Uncertain_DataSubNormal. If only one non-Bad raw value can be found before the timestamp then SteppedExtrapolation is used to estimate the bounding value.
Interpolated Bounding Values using SteppedInterpolation are calculated as follows:
· if a non-Bad Raw value exists at the timestamp then it is the bounding value;
· find the first non-Bad Raw value before timestamp;
· use the value as an estimate of the bounding value.
The StatusCode is Uncertain_DataSubNormal if any Bad values exist between the before value and the timestamp. If no non-Bad Raw data exists before the timestamp then the StatusCode is Bad_NoData. If the value before the timestamp is Uncertain the StatusCode is Uncertain_DataSubNormal. The value after the timestamp is not needed when using SteppedInterpolation; however, if the timestamp is after the end of the data then the bounding value is treated as extrapolated and the StatusCode is Uncertain_DataSubNormal.
SteppedExtrapolation is a term that describes SteppedInterpolation when a timestamp is after the last value in the history collection.
simple bounding values
bounding values determined by a calculation using the nearest value
Note 1 to entry: Simple Bounding Values using SlopedInterpolation are calculated as follows:
· if any Raw value exists at the timestamp then it is the bounding value;
· find the first Raw value before timestamp;
· find the first Raw value after timestamp;
· if the value after the timestamp is Bad then the before value is the bounding value;
· draw a line between before value and after value;
· use point where the line crosses the timestamp as an estimate of the bounding value.
The formula is the same as the one used for SlopedInterpolation in Clause 3.1.5.
If a Raw value at the timestamp is Bad the StatusCode is Bad_NoData. If the value before the timestamp is Bad the StatusCode is Bad_NoData. If the value before the timestamp is Uncertain the StatusCode is Uncertain_DataSubNormal. If the value after the timestamp is Bad or Uncertain the StatusCode is Uncertain_DataSubNormal.
Simple Bounding Values using SteppedInterpolation are calculated as follows:
· if any Raw value exists at the timestamp then it is the bounding value;
· find the first Raw value before timestamp;
· if the value before timestamp is non-Bad then it is the bounding value.
If a Raw value at the timestamp is Bad the StatusCode is Bad_NoData. If the value before the timestamp is Bad the StatusCode is Bad_NoData. If the value before the timestamp is Uncertain the StatusCode is Uncertain_DataSubNormal.
If either bounding time of an interval is beyond the last data point then the Server may use extrapolation or return an error. If extrapolation is used by the server the type [SteppedExtrapolation or SloppedExtrapolation] of extrapolation is server specific.
In some Historians, the last Raw value does not necessarily indicate the end of the data. Based on the Historian's knowledge of the data collection mechanism, i.e. frequency of data updates and latency, the Historian may extend the last value to a time known by the Historian to be covered. When calculating Simple Bounding Values the Historian will act as if there is another Raw value at this timestamp.
In the same way, if the earliest time of an interval starts before the first data point in history and the latest time is after the first data point in history, then the interval will be treated as if the interval extends from the first data point in history to the latest time of the interval and the StatusCode of the interval will have the Partial bit set (see 5.3.3.2).
The period of time that is searched to discover the values before and after the timestamp is Server dependent, but if a value is not found within some reasonable time range then the Server will assume it does not exist. The Server as a minimum should search a time range which is at least the size of the ProcessingInterval.
DA Data Access
HA Historical Access (access to historical data or events)
HDA Historical Data Access
OPC 10000-3 and OPC 10000-5 standards define the representation of Aggregate historical or buffered real time data in the OPC Unified Architecture. This includes the definition of Aggregates used in processed data retrieval and in historical retrieval. This definition includes both standard Reference types and Object types.
OPC UA Servers can support several different functionalities and capabilities. The following standard Objects are used to expose these capabilities in a common fashion, and there are several standard defined concepts that can be extended by vendors.
The AggregateConfigurationType defines the general characteristics of a Node that defines the Aggregate configuration of any Variable or Property. AggregateConfiguration Object represents the browse entry point for information on how the Server treats Aggregate specific functionality such as handling Uncertain data. It is formally defined in Table 2.
Table 2 – AggregateConfigurationType Definition
|
Attribute |
Value |
||||
|
BrowseName |
AggregateConfigurationType |
||||
|
IsAbstract |
False |
||||
|
References |
NodeClass |
BrowseName |
DataType |
TypeDefinition |
ModellingRule |
|
Subtype of the BaseObjectType defined in OPC 10000-5 |
|||||
|
HasProperty |
Variable |
TreatUncertainAsBad |
Boolean |
PropertyType |
Mandatory |
|
HasProperty |
Variable |
PercentDataBad |
Byte |
PropertyType |
Mandatory |
|
HasProperty |
Variable |
PercentDataGood |
Byte |
PropertyType |
Mandatory |
|
HasProperty |
Variable |
UseSlopedExtrapolation |
Boolean |
PropertyType |
Mandatory |
|
Conformance Units |
|||||
|
Aggregate Master Configuration |
|||||
The TreatUncertainAsBad Variable indicates how the Server treats data returned with a StatusCode severity Uncertain with respect to Aggregate calculations. A value of True indicates the Server considers the severity equivalent to Bad, a value of False indicates the Server considers the severity equivalent to Good, unless the Aggregate definition says otherwise. The default value is True. Note that the value is still treated as Uncertain when the StatusCode for the result is calculated.
The PercentDataBad Variable indicates the minimum percentage of Bad data in a given interval required for the StatusCode for the given interval for processed data request to be set to Bad. (Uncertain is treated as defined above.) Refer to 5.4.3 for details on using this Variable when assigning StatusCodes. For details on which Aggregates use the PercentDataBad Variable, see the definition of each Aggregate. The default value is 100.
The PercentDataGood Variable indicates the minimum percentage of Good data in a given interval required for the StatusCode for the given interval for the processed data requests to be set to Good. Refer to 5.4.3 for details on using this Variable when assigning StatusCodes. For details on which Aggregates use the PercentDataGood Variable, see the definition of each Aggregate. The default value is 100.
The following calculations are used to detemine the StatusCode which will be used to calculate the value of the aggregate. Refer to 5.4.3 for details on using these Variables when assigning StatusCodes. The PercentDataGood and PercentDataBad shall follow the following relationship PercentDataGood ≥ (100 – PercentDataBad). If they are equal the result of the PercentDataGood calculation is used. If the values entered for PercentDataGood and PercentDataBad do not result in a valid calculation (e.g. Bad = 80; Good = 0) the result will have a StatusCode of Bad_AggregateInvalidInputs The StatusCode Bad_AggregateInvalidInputs will be returned if the value of PercentDataGood or PercentDataBad exceed 100.
The UseSlopedExtrapolation Variable indicates how the Server interpolates data when no boundary value exists (i.e. extrapolating into the future from the last known value). A value of False indicates that the Server will use a SteppedExtrapolation format, and hold the last known value constant. A value of True indicates the Server will project the value using UseSlopedExtrapolation mode. The default value is False. For SimpleBounds this value is ignored.
This Object is used as the browse entry point for information about the Aggregates supported by a Server. The content of this Object is already defined by its type definition. All Instances of the FolderType use the standard BrowseName of ‘AggregateFunctions’. The HasComponent Reference is used to relate a ServerCapabilities Object and/or any HistoryServerCapabilitiesType Object to an AggregateFunction Object. AggregateFunctions is formally defined in Table 3.
Table 3 – Aggregate Functions Definition
|
Attribute |
Value |
|||||
|
BrowseName |
AggregateFunctions |
|||||
|
References |
Node Class |
BrowseName |
DataType |
TypeDefinition |
ModellingRule |
|
|
HasTypeDefinition |
Object Type |
FolderType |
Defined in OPC 10000-5 |
|||
|
Conformance Units |
||||||
|
Historical Access Aggregates |
||||||
Each ServerCapabilities and HistoryServerCapabilitiesType Object shall reference an AggregateFunction Object. In addition, each HistoricalConfiguration Object belonging to a HistoricalDataNode may reference an AggregateFunction Object using the HasComponent Reference.
This ObjectType defines an Aggregate supported by a UA Server. This Object is formally defined in Table 4.
Table 4 – AggregateFunctionType Definition
|
Attribute |
Value |
||||
|
BrowseName |
AggregateFunctionType |
||||
|
IsAbstract |
False |
||||
|
References |
Node Class |
BrowseName |
DataType |
Type |
Mod. |
|
Subtype of the BaseObjectType defined in OPC 10000-5 |
|||||
|
Conformance Units |
|||||
|
Historical Access Aggregates |
|||||
For the AggregateFunctionType, the Description Attribute (inherited from the Base NodeClass), is mandatory. The Description Attribute provides a localized description of the Aggregate.
Table 5 specifies the BrowseName and Description Attributes for the standard Aggregate Objects. The description is the localized “en” text. For other locales it shall be translated.
Table 5 – Standard AggregateType Nodes
|
Description |
|
|
|
Interpolation Aggregate |
|
Interpolative |
At the beginning of each interval, retrieve the calculated value from the data points on either side of the requested timestamp. |
|
Average |
Retrieve the average value of the data over the interval. |
|
TimeAverage |
Retrieve the time weighted average data over the interval using Interpolated Bounding Values. |
|
TimeAverage2 |
Retrieve the time weighted average data over the interval using Simple Bounding Values. |
|
Total |
Retrieve the total (time integral) of the data over the interval using Interpolated Bounding Values. |
|
Total2 |
Retrieve the total (time integral) of the data over the interval using Simple Bounding Values. |
|
Minimum |
Retrieve the minimum raw value in the interval with the timestamp of the start of the interval. |
|
Maximum |
Retrieve the maximum raw value in the interval with the timestamp of the start of the interval. |
|
MinimumActualTime |
Retrieve the minimum value in the interval and the timestamp of the minimum value. |
|
MaximumActualTime |
Retrieve the maximum value in the interval and the timestamp of the maximum value. |
|
Range |
Retrieve the difference between the minimum and maximum value over the interval. |
|
Minimum2 |
Retrieve the minimum value in the interval including the Simple Bounding Values. |
|
Maximum2 |
Retrieve the maximum value in the interval including the Simple Bounding Values. |
|
MinimumActualTime2 |
Retrieve the minimum value with the actual timestamp including the Simple Bounding Values. |
|
MaximumActualTime2 |
Retrieve the maximum value with the actual timestamp including the Simple Bounding Values. |
|
Range2 |
Retrieve the difference between the Minimum2 and Maximum2 value over the interval. |
|
Count |
Retrieve the number of raw values over the interval. |
|
DurationInStateZero |
Retrieve the time a Boolean or numeric was in a zero state using Simple Bounding Values. |
|
DurationInStateNonZero |
Retrieve the time a Boolean or numeric was in a non-zero state using Simple Bounding Values. |
|
NumberOfTransitions |
Retrieve the number of changes between zero and non-zero that a Boolean or numeric value experienced in the interval. |
|
Start |
Retrieve the value at the beginning of the interval. |
|
End |
Retrieve the value at the end of the interval. |
|
Delta |
Retrieve the difference between the Start and End value in the interval. |
|
StartBound |
Retrieve the value at the beginning of the interval using Simple Bounding Values. |
|
EndBound |
Retrieve the value at the end of the interval using Simple Bounding Values. |
|
DeltaBounds |
Retrieve the difference between the StartBound and EndBound value in the interval using Simple Bounding Values. |
|
DurationGood |
Retrieve the total duration of time in the interval during which the data is Good. |
|
DurationBad |
Retrieve the total duration of time in the interval during which the data is Bad. |
|
PercentGood |
Retrieve the percentage of data (0 to 100) in the interval which has Good StatusCode. |
|
PercentBad |
Retrieve the percentage of data (0 to 100) in the interval which has Bad StatusCode. |
|
WorstQuality |
Retrieve the worst StatusCode of data in the interval. |
|
WorstQuality2 |
Retrieve the worst StatusCode of data in the interval including the Simple Bounding Values. |
|
AnnotationCount |
Retrieve the number of Annotations in the interval (applies to Historical Aggregates only). |
|
StandardDeviationSample |
Retrieve the standard deviation for the interval for a sample of the population (n-1). |
|
VarianceSample |
Retrieve the variance for the interval as calculated by the StandardDeviationSample. |
|
StandardDeviation Population |
Retrieve the standard deviation for the interval for a complete population (n) which includes Simple Bounding Values. |
|
VariancePopulation |
Retrieve the variance for the interval as calculated by the StandardDeviationPopulation which includes Simple Bounding Values. |
The default values used for MonitoredItem Aggregates are the same as those used for historical Aggregates. They are defined in 4.2.1.2. For additional information on MonitoredItem AggregateFilter see OPC 10000-4.
When calculating MonitoredItem Aggregates that require the use of Bounding Values, the bounds may not be known. The calculation is done in the same manner as a historical read with the Partial Bit set. The historian may wait some amount of time (normally no more than one processing interval) before calculating the interval to allow for any latency in data collection and reduce the use of the Partial Bit.
A historical read done after data collection and the data from the MonitoredItem over the same interval may not be the same.
Figure 1 outlines a possible representation of Aggregate information in the AddressSpace. In this example, although the Server at the highest level may support Aggregate functionality for Interpolative, Total, Average, and others, DataVariable X only supports Interpolative, Total and Average, while DataVariable Y supports Average, a vendor defined Aggregate and other (unstated) Aggregates.
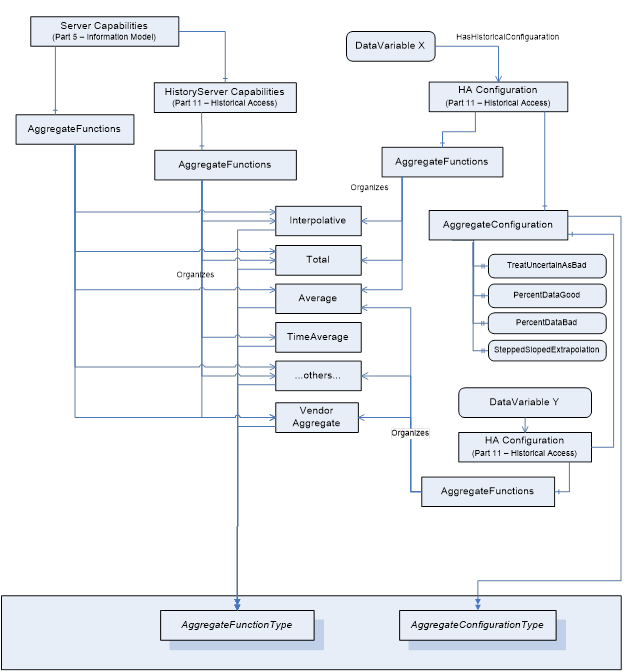
Figure 1 – Representation of Aggregate Configuration information in the AddressSpace
OPC 10000-4 specifies all Services needed for OPC UA Aggregates. In particular:
· The Browse Service Set or Query Service Set to detect Aggregates and their configuration.
· The HistoryRead Service of the Attribute Service Set to read the aggregated history of the HistoricalNodes.
· The CreateMonitoredItems Service allows specifying a filter for each MonitoredItem to read aggregated data.
The HistoryRead service defined in OPC 10000-4 can perform several different functions. The historyReadDetails parameter is an Extensible Parameter that specifies which function to perform. The ReadProcessedDetails structure is used to read aggregated data for HistoricalDataNodes.
The CreateMonitoredItems Service allows specifying a filter for each MonitoredItem. The MonitoringFilter is an extensible parameter whose structure depends on the type of item being monitored. The AggregateFilter structure is used to obtain aggregated data for a subscription.
ReadProcessedDetails structure is formally detailed in OPC 10000-11. Table 6 outlines the components of the ReadProcessedDetails structure for the purposes of discussion in this document.
Table 6 – ReadProcessedDetails
|
Name |
Description |
|
ReadProcessedDetails |
Specifies the details used to perform a “processed” history read. |
|
startTime |
Beginning of period to read. |
|
endTime |
End of period to read. |
|
processingInterval |
Interval between returned Aggregate values. |
|
aggregateType[] |
The NodeIds of the AggregateFunction Objects. AggregateFunction Objects indicate the list of Aggregates to be used when retrieving processed history. |
|
aggregateConfiguration |
Aggregate configuration structure. |
|
useServerDefaults |
If True the Server’s default values are used and any values specified for the other parameters are ignored. |
|
treatUncertainAsBad |
See 4.2.1.2. |
|
percentDataBad |
See 4.2.1.2. |
|
percentDataGood |
See 4.2.1.2. |
|
useSlopedExtrapolation |
See 4.2.1.2. |
The AggregateFilter defines the Aggregate function that should be used to calculate the values to be returned. The AggregateFilter is formally defined in OPC 10000-4. Table 7 outlines the components of the AggregateFilter structure for the purposes of discussion in this document.
Table 7 – AggregateFilter structure
|
Name |
Description |
|
AggregateFilter |
|
|
startTime |
Beginning of period to calculate the Aggregate the first time. |
|
aggregateType |
The NodeIds of the AggregateFunction Objects that indicates the list of Aggregates to be used when retrieving processed data. |
|
processingInterval |
The period to be used to compute the Aggregate. |
|
aggregateConfiguration |
This parameter allows Clients to override the Aggregate configuration settings supplied by an AggregateConfiguration Object on a per monitored item basis. |
|
useServerDefaults |
If True the Server’s default values are used and any values specified for the other parameters are ignored. |
|
treatUncertainAsBad |
See 4.2.1.2. |
|
percentDataBad |
See 4.2.1.2. |
|
percentDataGood |
See 4.2.1.2. |
|
useSlopedExtrapolation |
See 4.2.1.2. |
Subclause 5.3 defines additional codes and rules that apply to the StatusCode when used for Aggregates.
The general structure of the StatusCode is specified in OPC 10000-4. It includes a set of common operational result codes which also apply to Aggregates.
In OPC UA Aggregates the StatusCode is used to indicate the conditions under which a value or Event was stored, and thereby can be used as an indicator of its usability. Due to the nature of aggregated data, additional information beyond the basic quality and call result code needs to be conveyed to the client. For example, whether or not the result was Interpolated, were all data inputs to a calculation of Good quality, etc.
In the following, Table 8 contains codes with Bad
severity indicating a failure; Table 9 contains codes with Uncertain severity indicating that the value has
been retrieved under sub-normal conditions. It is important to note, that these
are the codes that are specific for
OPC UA Aggregates and that
they supplement the codes that apply to all types of data; they are therefore
defined in OPC 10000-4, OPC 10000-8 and OPC 10000-11.
Table 8 – Bad operation level result codes
|
Symbolic Id |
Description |
|
Bad_AggregateListMismatch |
The requested number of Aggregates does not match the requested number of NodeIds. When multiple Aggregates are requested, a corresponding NodeId is required for each AggregateFunction. |
|
Bad_AggregateNotSupported |
The requested AggregateFunction is not supported by the Server for the specified Node. |
|
Bad_AggregateInvalidInputs |
The Aggregate value could not be derived due to invalid data inputs, errors attempting to perform data conversions or similar situations. |
Table 9 – Uncertain operation level result codes
|
Symbolic Id |
Description |
|
Uncertain_DataSubNormal |
The value is derived from raw values and has less than the required number of Good values. |
These bits are set only when obtaining Aggregate data. They indicate where the data value came from and provide information that affects how the client uses the data value. Table 10 lists the bit settings which indicate the data location (i.e. is the value stored in the underlying data repository, or is the value the result of data aggregation). These bits are mutually exclusive.
Table 10 – Data location
|
StatusCode |
Description |
|
Raw |
A Raw data value. |
|
Calculated |
A data value which was calculated. |
|
Interpolated |
A data value which was interpolated. |
In the case where Interpolated data is requested, and there is an actual raw value for that timestamp, the Server should set the ‘Raw’ bit in the StatusCode of that value.
Table 11 lists the bit settings which indicate additional important information about the data values returned.
Table 11 – Additional information
|
StatusCode |
Description |
|
Partial |
A calculated value that is not based on a complete interval. See 5.3.3.2. |
|
Extra Data |
If a Server chooses to set this bit, it indicates that a Raw data value supersedes other data at the same timestamp. |
|
Multiple Values |
Multiple values match the Aggregate criteria (i.e. multiple minimum values or multiple worst quality at different timestamps within the same ProcessingInterval). |
The conditions under which these information bits are set depend on how the data has been requested and state of the underlying data repository.
Partial bit is used to indicate that the interval is not a complete interval and that a client may receive a different value for the Aggregate if it re-fetches the interval with the same parameters.
The Partial bit will be set in the following examples:
Assume for these examples the first stored point in the collection is 1:01:10 and the last stored point in the collection is 1:31:20. Older data may exist but is unavailable or offline at the time of the query. Newer data may be available but has not yet been stored in the history collection.
· The interval that overlaps the beginning of the history collection. If the start time is 1:00:00 and end time is 1:10:00 and the interval is 2 minutes then the first interval would have a Partial bit set since it has no data for the first 70 seconds. The Partial bit will always be set for the first interval with data if the start time of the interval is before the first data value of the data collection. For intervals prior to the interval with a Partial bit, these intervals will be flagged Bad_NoData.
· The interval that overlaps the latest point stored in the history collection. The last point in the collection is 1:31:20 and the historian was not shut down and is still running. A 6-minute interval that started at 1:30:00 would have the Partial bit set because the historian is expecting data, but just has not yet received anything. The Partial bit will always be set for the last interval with data if the end time of the interval is after the last data value stored in the data collection. Intervals entirely after the interval with a Partial bit will be flagged Bad_NoData. For those Aggregates with extrapolation, the Partial bit may be set. See the Aggregate specific characteristics for more details.
· If the start/end time does not result in an even interval and there is additional data beyond the end time then the last interval will have a Partial bit. If the start time is 1:00:00 and end time is 1:20:00 and the interval is 6 minutes then the last interval is just 2 minutes long and will have the Partial bit set. Extrapolation does not apply in this case.
The Partial bit may be set with the Calculated bit when the Calculated bit is always set for the specific Aggregate.
The purpose of subclause 5.4 is to detail the requirements and behaviour for OPC UA Servers supporting Aggregates. The intent is to standardize the Aggregates so users can reliably predict the results of an Aggregate computation and understand its meaning. If users require custom functionality in the Aggregates, those Aggregates should be written as custom vendor defined Aggregates.
The standard Aggregates shall be as consistent as possible, meaning that each Aggregate’s behaviour shall be similar to every other Aggregate’s behaviour where input parameters, Raw data, and boundary conditions are similar. Where possible, the Aggregates should deal with input and preconditions in a similar manner.
Subclause 5.4 is divided up into two parts. Subclause 5.4.2 deals with Aggregate characteristics and behaviour that are common to all Aggregates. Subclause 5.4.3 deals with the characteristics and behaviour of Aggregates that are aggregate-specific.
Subclause 5.4.2 deals with Aggregate characteristics and behaviour that are common to all Aggregates.
To read Historical Aggregates, OPC clients shall specify three time parameters:
– startTime (Start)
– endTime (End)
– ProcessingInterval (Int)
The OPC Server shall use these three parameters to generate a sequence of time intervals and then calculate an Aggregate for each interval. Subclause 5.4.2.2 specifies, given the three parameters, which time intervals are generated. Table 12 provides information on the intervals for each Start and End time combination. The range is defined to be |End - Start|.
All Aggregates return a timestamp of the start of the interval unless otherwise noted for the particular Aggregate.
Table 12 – History Aggregate interval information
|
Start/End Time |
Interval |
Resulting intervals |
|
Start = End |
Int = Anything |
No intervals. Returns a Bad_InvalidArgument StatusCode, regardless of whether there is data at the specified time or not. |
|
Start < End |
Int = 0 or Int ≥ Range |
One interval, starting at Start and ending at End. Includes Start, excludes End, i.e., [Start, End). |
|
Start < End |
Int ≠ 0, Int < Range, Int divides Range evenly. |
Range/Int intervals. Intervals are [Start, Start + Int), [Start + Int, Start + 2 x Int),..., [End - Int, End). |
|
Start < End |
Int ≠ 0, Int < Range, Int does not divide Range evenly. |
éRange/Intù intervals. Intervals are [Start, Start + Int), [Start + Int, Start + 2 x Int),..., [Start + ( ëRange/Intû - 1) x Int, Start + ëRange/Intû x Int), [Start + ëRange/Intû x Int, End). In other words, the last interval contains the “rest” that remains in the range after taking away ëRange/Intû intervals of size Int. |
|
Start > End |
Int = 0 or Int ≥ Range |
One interval, starting at Start and ending at End. Includes Start, excludes End, i.e.,[Start, End). a |
|
Start > End |
Int ≠ 0, Int < Range, Int divides Range evenly. |
Range/Int intervals. Intervals are [Start, Start- Int), [Start– Int, Start – 2 x Int),..., [End + Int, End). a |
|
Start > End |
Int ≠ 0, Int < Range, Int does not divide Range evenly. |
éRange/Intù intervals. Intervals are [Start, Start - Int), [Start –Int,Start - 2 x Int),..., [Start – ( ëRange/Intû - 1) x Int , Start - ëRange/Intû x Int), [Start - ëRange/Intû x Int , End). In other words, the last interval contains the “rest” that remains in the range after taking away ëRange/Intû intervals of size Int starting at Start. a |
|
a In this case time is running backwards on the intervals. |
||
The calculation of all Aggregates when time flows backwards is the same as when time flows forwards with the exception that the ‘early time’ is excluded from the interval and the ‘late time’ is included. In most cases this means the value will be the same except the timestamps are shifted by one ProcessingInterval. E.g. when time flows forward the value at T = n is the same as the value at T = n + 1 when time flows backward.
Note that when determining Aggregates with MonitoredItem, the interval is simply the ProcessingInterval parameter as defined in the AggregateFilter structure. See OPC 10000-4 for more details.
Table 13 outlines the valid DataType for each Aggregate. Some Aggregates are intended for numeric data types – i.e. integers or real/floating point numbers. Dates, strings, arrays, etc. are not supported. Other Aggregates are intended for digital data types – i.e. Boolean or enumerations. In addition some Aggregates may return results with a different DataType than those used to calculate the Aggregate. Table 13 also outlines the data type returned for each Aggregate.
Table 13 – Standard History Aggregate Data Type information
|
BrowseName |
Valid Data Type |
Result Data Type |
|
|
Interpolation Aggregate |
|
|
Interpolative |
Numeric |
Raw Data Type |
|
|
Data Averaging Aggregates |
|
|
Average |
Numeric |
Double |
|
TimeAverage |
Numeric |
Double |
|
TimeAverage2 |
Numeric |
Double |
|
Total |
Numeric |
Double |
|
Total2 |
Numeric |
Double |
|
|
Data Variation Aggregates |
|
|
Minimum |
Numeric |
Raw data type |
|
Maximum |
Numeric |
Raw data type |
|
MinimumActualTime |
Numeric |
Raw data type |
|
MaximumActualTime |
Numeric |
Raw data type |
|
Range |
Numeric |
Raw data type |
|
Minimum2 |
Numeric |
Raw data type |
|
Maximum2 |
Numeric |
Raw data type |
|
MinimumActualTime2 |
Numeric |
Raw data type |
|
MaximumActualTime2 |
Numeric |
Raw data type |
|
Range2 |
Numeric |
Raw data type |
|
|
Counting Aggregates |
|
|
AnnotationCount |
All |
Integer |
|
Count |
All |
Integer |
|
DurationInStateZero |
Numeric or Boolean |
Duration |
|
DurationInStateNonZero |
Numeric or Boolean |
Duration |
|
NumberOfTransitions |
Numeric or Boolean |
Integer |
|
|
Time Aggregates |
|
|
Start |
All |
Raw data type |
|
End |
All |
Raw data type |
|
Delta |
Numeric |
Raw data type |
|
StartBound |
All |
Raw data type |
|
EndBound |
All |
Raw data type |
|
DeltaBounds |
Numeric |
Raw data type |
|
|
Data Quality Aggregates |
|
|
DurationGood |
All |
Duration |
|
DurationBad |
All |
Duration |
|
PercentGood |
All |
Double |
|
PercentBad |
All |
Double |
|
WorstQuality |
All |
StatusCode |
|
WorstQuality2 |
All |
StatusCode |
|
|
Statistical Aggregates |
|
|
StandardDeviationSample |
Numeric |
Double |
|
VarianceSample |
Numeric |
Double |
|
StandardDeviationPopulation |
Numeric |
Double |
|
VariancePopulation |
Numeric |
Double |
The following issues may come up when calculating Aggregates that include time as part of the calculation.
· All Aggregate calculations include the startTime but exclude the endTime. However, it is sometimes necessary to return an Interpolated End Bound as the value for an Interval with a timestamp that is in the Interval. Servers are expected to use the time immediately before endTime where the time resolution of the Server determines the exact value (do not confuse this with hardware or operating system time resolution). For example, if the endTime is 12:01:00, the time resolution is 1 second, then the EffectiveEndTime is 12:00:59. If the Server time resolution is 1 millisecond the EffectiveEndTime is 12:00:59.999.
If time is flowing backwards, Servers are expected to use the time immediately after endTime where the time resolution of the Server determines the exact value.
· If there is one data point in the Interval and it falls on the StartTime the time duration used in calculations is one unit of the time resolution of the Server.
When accessing aggregated data using the HistoryRead or the CreateMonitoredItems Service, the following rules are used to handle specific Aggregate use cases.
If ProcessingInterval is 0, the Server shall create one Aggregate value for the entire time range. This allows Aggregates over large periods of time. A value with a timestamp equal to endTime will be excluded from that Aggregate, just as it would be excluded from an interval with that ending time. If the ProcessingInterval of 0 is passed in the MonitoredItemFilter it shall be revised to a suitable non-zero value.
The timestamp returned with the Aggregate shall be the time at the beginning of the interval, except where the Aggregate specifies a different timestamp.
If a requested timestamp is set to anything but the source timestamp the operation shall return the Bad_TimestampToReturnInvalid StatusCode. If a requested timestamp is not supported in any other way for a HistoricalDataNode, the operation shall return the Bad_TimestampNotSupported StatusCode. For MonitoredItem the Server shall not return past data if a requested timestamp is not supported by the history collection.
StatusCodes for an Aggregate value shall take into account the values used to calculate them. In addition, the configuration parameters PercentDataGood and PercentDataBad allow the client to control how this calculation is done if supported by the Server.
If an Aggregate operates on raw values (e.g. Average) the calculation is done by counting values. If an Aggregate operates on raw values but can also return a Bounding Value then the Bounding Values are included in the count when computing the StatusCode. If an Aggregate does any sort of a time weighted calculation (e.g. TimeAverage or TimeAverage2) then the StatusCode calculation shall also be time weighted.
For purposes of calculating time weighted StatusCodes each interval shall be divided into regions of Good or Bad data. Creating these regions requires that the bounding values be calculated for each interval and the type of bounding value depends on the Aggregate.
Use the following to determine the StatusCode of a given aggregate. If TreatUncertainAsBad = False then Uncertain regions are included with the Good regions when calculating the above ratios, if the TreatUncertainAsBad = True then the Uncertain regions are included as Bad regions. If no Bad regions are in the interval then the StatusCode for the interval is Good. For any intervals containing regions where the StatusCodes are Bad, the total duration of all Bad regions is calculated and divided by the width of the interval. The resulting ratio is multiplied by 100 and compared to the PercentDataBad parameter. The StatusCode for the interval is Bad if the ratio is greater than or equal to the PercentDataBad parameter. For any interval which is not Bad, the total duration of all Good regions is then calculated and divided by the width of the interval. The resulting ratio is multiplied by 100 and compared to the PercentDataGood parameter. The StatusCode for the interval is Good if the ratio is greater than or equal to the PercentDataGood parameter. If for an interval neither ratio applies then that interval is Uncertain_DataSubNormal.
If there is no data in the interval and the interval is inside the range [start of data, end of data] and the Aggregate return data type is raw data type then the StatusCodes for the interval will be Bad_NoData unless an alternate status code is defined for a specific Aggregate.
The width of an interval is the ProcessingInterval unless it is a partial interval (i.e. has the Partial bit set). In these cases, the width is the time used when calculating the partial interval.
Subclauses 5.4.3.2.2 and 5.4.3.2.3 include diagrams that illustrate a request and data series. The colour of the time axis indicates the status for different regions. Red indicates Bad, green indicates Good and orange indicates Uncertain. These examples assume TreatUncertainAsBad = False.
Figure 2 illustrates a data series for Variable with Stepped = False and an Aggregate that uses Simple Bounding Values. The request being processed has a Start Time that falls before the first point in the series and an End Time that does not fall on an integer multiple of the ProcessingInterval.
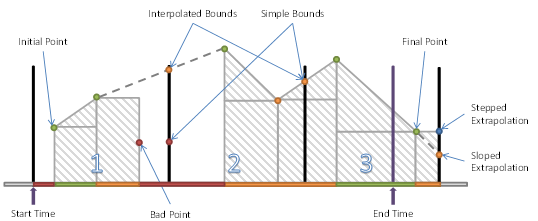
Figure 2 – Variable with Stepped = False and Simple Bounding Values
The first interval has four regions:
· the period before the first data point;
· the period between the first and second where SlopedInterpolation can be used;
· the period between the second and third point where SteppedInterpolation is used;
· the period after the Bad point where no data exists.
A region is Uncertain if a region ends in a Bad or Uncertain value and SlopedInterpolation is used. The end point has no effect on the region if SteppedInterpolation is used.
The second interval has three regions:
· the period before the first Good data point where no data exists;
· the period between the first and second where SlopedInterpolation can be used;
· the period between the second point and the bound calculated with SlopedInterpolation.
The third interval has three regions:
· the period between the simple bound and the first data point;
· the period between the first point and an interpolated point that falls on the end time;
· the period after the end time which is ignored.
This is a partial region and the data after the end time is not used, however, if sloped interpolation is used and the point after the endpoint is Uncertain then the region between the last point and the end time will be Uncertain.
Figure 3 illustrates a data series for Variable with Stepped = True and an Aggregate that uses Interpolated Bounding Values. The request being processed has a Start Time that falls before the first point in the series and an End Time that does not fall on an integer multiple of the ProcessingInterval.
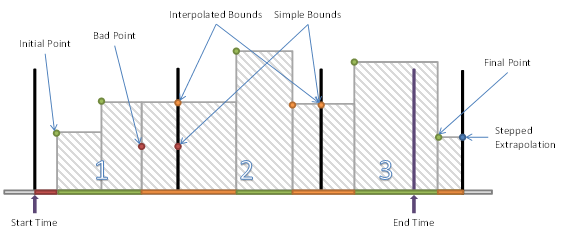
Figure 3 – Variable with Stepped = True and Interpolated Bounding Values
The first interval has three regions:
· the period before the first data point;
· the period between the first and second where SteppedInterpolation is used;
· the period between the second and the interpolated end bound.
The Bad point is ignored because of the interpolated end bound but this does create Uncertain regions. If SlopedInterpolation was used the Uncertain region would start at the second point. In this case, it only starts when the first Bad value is ignored.
The second interval has three regions:
· the period between the start bound and the first data point;
· the period between the first and second where SteppedInterpolation is used;
· the period between the second and the interpolated end bound.
The third interval has three regions:
· the period between the interpolated bound and the first data point;
· the period between the first point and an interpolated point that falls on the end time;
· the period after the end time which is ignored.
This is a partial region and the data after the end time is not used.
Subclause 5.4.3.3 deals with Aggregate specific characteristics and behaviour that is specific to a particular Aggregate.
Each subclause has a table which formally expresses the Aggregate behaviour (including any exceptions). The meaning of each of the fields in the table is described in Table 14.
Description of Table 14:
· The first column is the common name for the item.
· The second column includes a description of the item and a list of the valid selections with for the item including a description of each selection.
· The second part of the table describes how the status associated with the Aggregate calculation is computed.
· The last part of the table lists what behaviour is expected from the Aggregate for some common special cases. These behaviours require text descriptions so there is no list of valid selections.
Table 14 – Aggregate table description
|
Aggregate Characteristics |
|
|
Type |
The type of Aggregate. <Interpolated | Calculated | Raw>
Interpolated: See definition for Interpolated. Calculated: Computed from defined calculation. Raw: Selects a raw value from within an interval. |
|
Data Type |
The data type of the result. <Double | Int32 | Same as Source> |
|
Use Bounds |
How the Aggregate deals with bounds. <None | Interpolated | Simple>
None: Bounds do not apply to the Aggregate. Interpolated: Uses Interpolated Bounds. Simple: Uses Simple Bounds. |
|
Timestamp |
What is the time stamp of the resulting Aggregate value: <startTime | endTime | Raw>
startTime: The time at the start of the interval. endTime: The time at the end of the interval. Raw: The time associated with a value in the interval. |
|
|
|
|
StatusCode Calculations |
|
|
Calculation Method |
How the status code is calculated: <PercentValues | PercentTime | Custom>
PercentValues: Based on percentage of value counts. PercentTime: Based on percentage of time interval. Custom: Specific to the Aggregate (description included). |
|
Partial |
For partial intervals does the Aggregate set this bit <Set Sometimes | Not Set>
It may also describe any special cases for setting this bit |
|
Calculated |
Describes the usage of the calculated bit. <Set Always | Set Sometimes | Not Set>
Set Always: The bit is always set. Set Sometimes: The bit is sometimes set (describes when). Not Set: The bit is never set. |
|
Interpolated |
Describes the usage of the interpolated bit. <Set Always | Set Sometimes | Not Set>
Set Always: The bit is always set. Set Sometimes: The bit is sometimes set (describes when). Not Set: The bit is never set. |
|
Raw |
Describes the usage of the Raw bit. <Set Always | Set Sometimes | Not Set>
Set Always: The bit is always set. Set Sometimes: The bit is sometimes set (describes when). Not Set: The bit is never set. |
|
Multi Value |
Describes the usage of the multi value bit. <Set Sometimes | Not Set>
Set Sometimes: The bit is used (see OPC 10000-11). Not Set: The bit is never set. |
|
|
|
|
StatusCode Common Special Cases |
|
|
Before Start of Data |
If the entire interval is before the start of data. |
|
After End of Data |
If the entire interval is after the end of data (as determined by the Historian). |
|
Start Bound Not Found |
If the starting bound is not found for the earliest interval and it is not partial, then what, if any, special processing should be done. |
|
End Bound Not Found |
If the ending bound is not found for the latest interval and it is not partial, then what, if any, special processing should be done. |
|
Bound Bad |
If the Bounding value is Bad, then what, if any, special processing should be done. |
|
Bound Uncertain |
If the Bounding value is uncertain, then what, if any, special processing should be done. |
The Interpolative Aggregate defined in Table 15 returns the Interpolated Bounding Value (see 3.1.8) for the startTime of each interval.
When searching for Good values before or after the bounding value, the time period searched is Server specific, but the Server should search a time range which is at least the size of the ProcessingInterval.
Table 15 – Interpolative Aggregate summary
|
Interpolated Aggregate Characteristics |
|
|
Type |
Interpolated |
|
Data Type |
Same as Source |
|
Use Bounds |
Interpolated |
|
Timestamp |
StartTime |
|
|
|
|
StatusCode Calculations |
|
|
Calculation Method |
Custom Good if no Bad values skipped and Good values are used, Uncertain if Bad values skipped or if Uncertain values are used. If no starting value then Bad_NoData. See description of Interpolated Bounds (see 3.1.8) for more details |
|
Partial bit |
Not Set |
|
Calculated bit |
Not Set |
|
Interpolated bit |
Set Sometimes Always set except for when the Raw bit is set |
|
Raw bit |
Set Sometimes If a value exists with the exact time of interval Start |
|
Multi Value bit |
Not Set |
|
|
|
|
StatusCode Common Special Cases |
|
|
Before Start of Data |
Return Bad_NoData |
|
After End of Data |
Return extrapolated value (see 3.1.8) (sloped or stepped according to settings) Status code is Uncertain_DataSubNormal. |
|
Start Bound Not Found |
Bad_NoData. |
|
End Bound Not Found |
See “After End of Data” |
|
Bound Bad |
Does not return a Bad bound except as noted above |
|
Bound Uncertain |
Returned Uncertain_DataSubNormal if any Bad value(s) was/were skipped to calculate the bounding value. |
The Average Aggregate defined in Table 16 adds up the values of all Good Raw data for each interval, and divides the sum by the number of Good values. If any non-Good values are ignored in the computation, the Aggregate StatusCode will be determined using the StatusCode Calculation (see 5.3). This Aggregate is not time based so the PercentGood/PercentBad applies to the number of values in the interval.
Table 16 – Average Aggregate summary
|
Average Aggregate Characteristics |
|
|
Type |
Calculated |
|
Data Type |
Double |
|
Use Bounds |
None |
|
Timestamp |
StartTime |
|
|
|
|
StatusCode Calculations |
|
|
Calculation Method |
PercentValues |
|
Partial |
Not Set |
|
Calculated |
Set Always |
|
Interpolated |
Not Set |
|
Raw |
Not Set |
|
Multi Value |
Not Set |
|
|
|
|
StatusCode Common Special Cases |
|
|
Before Start of Data |
Bad_NoData |
|
After End of Data |
Bad_NoData |
|
No Start Bound |
Bounds not used |
|
No End Bound |
Bounds not used |
|
Bound Bad |
Bounds not used |
|
Bound Uncertain |
Bounds not used |
The TimeAverage Aggregate defined in Table 17 uses Interpolated Bounding Values (see 3.1.8) to find the value of a point at the beginning and end of an interval. Starting at the starting bounding value a straight line is drawn between each value in the interval ending at the ending bounding value (see examples for illustrations). The area under the lines is divided by the length of the ProcessingInterval to yield the average. Note that this calculation always uses a sloped line between points; TimeAverage2 uses a stepped or sloped line depending on the value of the Stepped Property for the Variable.
If one or more Bad Values exist in the interval then they are omitted from the calculation and the StatusCode is set to Uncertain_DataSubNormal. Sloped lines are drawn between the Good values when calculating the area.
The time resolution used in this calculation is Server specific.
Table 17 – TimeAverage Aggregate summary
|
TimeAverage Aggregate Characteristics |
|
|
Type |
Calculated |
|
Data Type |
Double |
|
Use Bounds |
Interpolated |
|
Timestamp |
StartTime |
|
|
|
|
StatusCode Calculations |
|
|
Calculation Method |
Custom Good if no Bad values skipped and Good values are used, Uncertain if Bad values are skipped or if Uncertain values are used |
|
Partial |
Set Sometimes If an interval is not a complete interval |
|
Calculated |
Set Always |
|
Interpolated |
Not Set |
|
Raw |
Not Set |
|
Multi Value |
Not Set |
|
|
|
|
StatusCode Common Special Cases |
|
|
Before Start of Data |
Bad_NoData |
|
After End of Data |
Value extrapolated, Uncertain status |
|
No Start Bound |
Calculate Partial Interval |
|
No End Bound |
Extrapolate data, Uncertain status |
|
Bound Bad |
NA |
|
Bound Uncertain |
NA |
The TimeAverage2 Aggregate defined in Table 18 uses Simple Bounding Values (see 3.1.9) to find the value of a point at the beginning and end of an interval. Starting at the starting bounding value a straight line is drawn between each value in the interval ending at the ending bounding value (see examples for illustrations). The area under the lines is divided by the length of the ProcessingInterval to yield the average. Note that this calculation uses a stepped or sloped line depending on what the value of the Stepped Property for the Variable; TimeAverage always uses a sloped line between points.
The time resolution used in this calculation is Server specific.
If any non-Good data exists in the interval, this data is omitted from the calculation and the time interval is reduced by the duration of the non-Good data; i.e. if a value was Bad for 1 minute in a 5-minute interval then the TimeAverage2 would be the area under the 4-minute period of Good values divided by 4 minutes. If a sub-interval ends at a Bad value then only the Good starting value is used to calculate the area of sub-interval preceding the Bad value.
The Aggregate StatusCode will be determined using the StatusCode Calculation (see 5.3).
Table 18 – TimeAverage2 Aggregate summary
|
TimeAverage2 Aggregate Characteristics |
|
|
Type |
Calculated |
|
Data Type |
Double |
|
Use Bounds |
Simple |
|
Timestamp |
StartTime |
|
|
|
|
StatusCode Calculations |
|
|
Calculation Method |
PercentTime |
|
Partial |
Set Sometimes If an interval is not a complete interval |
|
Calculated |
Set Always |
|
Interpolated |
Not Set |
|
Raw |
Not Set |
|
Multi Value |
Not Set |
|
|
|
|
StatusCode Common Special Cases |
|
|
Before Start of Data |
Bad_NoData |
|
After End of Data |
Bad_NoData |
|
No Start Bound |
Bound is Bad_NoData and treated as any other Bad value in the interval |
|
No End Bound |
Bound is Bad_NoData and treated as any other Bad value in the interval |
|
Bound Bad |
Treated as any other Bad value in the interval |
|
Bound Uncertain |
Treated as any other Uncertain value in the interval |
The Total Aggregate defined in Table 19 performs the following calculation for each interval:
Total = TimeAverage x ProcessingInterval (seconds)
where: TimeAverage is the result from the TimeAverage Aggregate, using the ProcessingInterval supplied to the Total call.
The resulting units would be normalized to seconds, i.e. [TimeAverage Units] x seconds.
The Aggregate StatusCode will
be determined using the StatusCode Calculation
(see 5.3).
Note that this calculation always uses a SlopedInterpolation between points; Total2 uses a Stepped Attribute or SlopedInterpolation depending on the value of the Stepped Attribute for the Variable.
Table 19 – Total Aggregate summary
|
Total Aggregate Characteristics |
||
|
Type |
Calculated |
|
|
Data Type |
Double |
|
|
Use Bounds |
Interpolated |
|
|
Timestamp |
StartTime |
|
|
|
||
|
StatusCode Calculations |
||
|
Calculation Method |
Custom Good if no Bad values are skipped and Good values are used, Uncertain if Bad values are skipped or if Uncertain values are used |
|
|
Partial |
Set Sometimes If an interval is not a complete interval |
|
|
Calculated |
Set Always |
|
|
Interpolated |
Not Set |
|
|
Raw |
Not Set |
|
|
Multi Value |
Not Set |
|
|
|
||
|
StatusCode Common Special Cases |
||
|
Before Start of Data |
Bad_NoData |
|
|
After End of Data |
Value extrapolated, Uncertain status |
|
|
No Start Bound |
Calculate Partial Interval |
|
|
No End Bound |
Extrapolate data, Uncertain status |
|
|
Bound Bad |
NA |
|
|
Bound Uncertain |
NA |
|
The Total2 Aggregate defined in Table 20 performs the following calculation for each interval:
Total2 = TimeAverage2 x ProcessingInterval of Good data (seconds)
where TimeAverage2 is the result from the TimeAverage2 Aggregate, using the ProcessingInterval supplied to the Total2 call.
The interval of Good data is the sum of all sub-intervals where non-Bad data exists; i.e. if a value was Bad for 1 minute in a 5-minute interval then the interval of Good data would be the 4-minute period.
The resulting units would be normalized to seconds, i.e. [TimeAverage2 Units] x seconds.
The Aggregate StatusCode will
be determined using the StatusCode Calculation
(see 5.3).
Table 20 – Total2 Aggregate summary
|
Total2 Aggregate Characteristics |
||
|
Type |
Calculated |
|
|
Data Type |
Double |
|
|
Use Bounds |
Simple |
|
|
Timestamp |
StartTime |
|
|
|
||
|
StatusCode Calculations |
||
|
Calculation Method |
PercentTime |
|
|
Partial |
Set Sometimes If an interval is not a complete interval |
|
|
Calculated |
Set Always |
|
|
Interpolated |
Not Set |
|
|
Raw |
Not Set |
|
|
Multi Value |
Not Set |
|
|
|
||
|
StatusCode Common Special Cases |
||
|
Before Start of Data |
Bad_NoData |
|
|
After End of Data |
Bad_NoData |
|
|
No Start Bound |
Value for Bound is Bad_NoData and is treated like any other Bad quality value in the calculation (ignored) |
|
|
No End Bound |
Value for Bound is Bad_NoData and is treated like any other Bad quality value in the calculation (ignored) |
|
|
Bound Bad |
Value is treated like any other Bad quality value in the calculation (ignored) |
|
|
Bound Uncertain |
Value is treated like any other non-Good quality value in the calculation (ignored) |
|
The Minimum Aggregate defined in Table 21 retrieves the minimum Good raw value within the interval, and returns that value with the timestamp at the start of the interval. Note that if the same minimum exists at more than one timestamp the MultipleValues bit is set.
Unless otherwise indicated, StatusCodes are Good, Calculated. If the minimum value is on the start time the status code will be Good, Raw. If only Bad quality values are available then the status is returned as Bad_NoData.
The timestamp of the Aggregate will always be the start of the interval for every ProcessingInterval.
Table 21 – Minimum Aggregate summary
|
Minimum Aggregate Characteristics |
||
|
Type |
Calculated |
|
|
Data Type |
Same as Source |
|
|
Use Bounds |
None |
|
|
Timestamp |
StartTime |
|
|
|
||
|
StatusCode Calculations |
||
|
Calculation Method |
Custom If no Bad values then the Status is Good. If Bad values exist then the Status is Uncertain_SubNormal. If an Uncertain value is less than the minimum Good value the Status is Uncertain_SubNormal. |
|
|
Partial |
Set Sometimes If an interval is not a complete interval |
|
|
Calculated |
Set Sometimes If the Minimum value is not on the StartTime of the interval or if the Status was set to Uncertain_SubNormal because of non-Good values in the interval |
|
|
Interpolated |
Not Set |
|
|
Raw |
Set Sometimes If Minimum value is on the StartTime of the interval |
|
|
Multi Value |
Set Sometimes If multiple Good values exist with the Minimum value |
|
|
|
||
|
StatusCode Common Special Cases |
||
|
Before Start of Data |
Bad_NoData |
|
|
After End of Data |
Bad_NoData |
|
|
No Start Bound |
Not Applicable |
|
|
No End Bound |
Not Applicable |
|
|
Bound Bad |
Not Applicable |
|
|
Bound Uncertain |
Not Applicable |
|
The Maximum Aggregate defined in Table 22 retrieves the maximum Good raw value within the interval, and returns that value with the timestamp at the start of the interval. Note that if the same maximum exists at more than one timestamp the MultipleValues bit is set.
Unless otherwise indicated, StatusCodes are Good, Calculated. If the maximum value is on the interval start time the status code will be Good, Raw. If only Bad quality values are available then the status is returned as Bad_NoData.
The timestamp of the Aggregate will always be the start of the interval for every ProcessingInterval.
Table 22 – Maximum Aggregate summary
|
Maximum Aggregate Characteristics |
||
|
Type |
Calculated |
|
|
Data Type |
Same as Source |
|
|
Use Bounds |
None |
|
|
Timestamp |
StartTime |
|
|
|
||
|
StatusCode Calculations |
||
|
Calculation Method |
Custom If no Bad values then the Status is Good. If Bad values exist then the Status is Uncertain_SubNormal. If an Uncertain value is greater than the maximum Good value the Status is Uncertain_SubNormal |
|
|
Partial |
Set Sometimes If an interval is not a complete interval |
|
|
Calculated |
Set Sometimes If the Maximum value is not on the startTime of the interval or if the Status was set to Uncertain_SubNormal because of non-Good values in the interval |
|
|
Interpolated |
Not Set |
|
|
Raw |
Set Sometimes If Maximum value is on the startTime of the interval |
|
|
Multi Value |
Set Sometimes If multiple Good values exist with the Maximum value |
|
|
|
||
|
StatusCode Common Special Cases |
||
|
Before Start of Data |
Bad_NoData |
|
|
After End of Data |
Bad_NoData |
|
|
No Start Bound |
Not Applicable |
|
|
No End Bound |
Not Applicable |
|
|
Bound Bad |
Not Applicable |
|
|
Bound Uncertain |
Not Applicable |
|
The MinimumActualTime Aggregate defined in Table 23 retrieves the minimum Good raw value within the interval, and returns that value with the timestamp at which that value occurs. Note that if the same minimum exists at more than one timestamp, the oldest one is retrieved and the Aggregate Bits are set to MultipleValues.
Table 23 – MinimumActualTime Aggregate summary
|
MinimumActualTime Aggregate Characteristics |
||
|
Type |
Calculated |
|
|
Data Type |
Same as Source |
|
|
Use Bounds |
None |
|
|
Timestamp |
Time of Minimum |
|
|
|
||
|
StatusCode Calculations |
||
|
Calculation Method |
Custom If no Bad values then the Status is Good. If Bad values exist then the Status is Uncertain_SubNormal. If an Uncertain value is less than the minimum Good value the Status is Uncertain_SubNormal |
|
|
Partial |
Set Sometimes If an interval is not a complete interval |
|
|
Calculated |
Set Sometimes If the Status was set to Uncertain_SubNormal because of non-Good values in the interval |
|
|
Interpolated |
Not Set |
|
|
Raw |
Set Sometimes If a Good minimum value is returned |
|
|
Multi Value |
Set Sometimes If multiple Good values exist with the Minimum value |
|
|
|
||
|
StatusCode Common Special Cases |
||
|
Before Start of Data |
Bad_NoData |
|
|
After End of Data |
Bad_NoData |
|
|
No Start Bound |
Not Applicable |
|
|
No End Bound |
Not Applicable |
|
|
Bound Bad |
Not Applicable |
|
|
Bound Uncertain |
Not Applicable |
|
The MaximumActualTime Aggregate defined in Table 24 is the same as the MinimumActualTime Aggregate, except that the value is the maximum raw value within the interval. Note that if the same maximum exists at more than one timestamp, the oldest one is retrieved and the Aggregate Bits are set to MultipleValues.
Table 24 – MaximumActualTime Aggregate summary
|
MaximumActualTime Aggregate Characteristics |
||
|
Type |
Calculated |
|
|
Data Type |
Same as Source |
|
|
Use Bounds |
None |
|
|
Timestamp |
Time of Maximum |
|
|
|
||
|
StatusCode Calculations |
||
|
Calculation Method |
Custom If no Bad values then the Status is Good. If Bad values exist then the Status is Uncertain_SubNormal. If an Uncertain value is greater than the maximum Good value the Status is Uncertain_SubNormal |
|
|
Partial |
Set Sometimes If an interval is not a complete interval |
|
|
Calculated |
Set Sometimes If the Status was set to Uncertain_SubNormal because of non-Good values in the interval |
|
|
Interpolated |
Not Set |
|
|
Raw |
Set Sometimes If a Good maximum value is returned |
|
|
Multi Value |
Set Sometimes If multiple Good values exist with the maximum value |
|
|
|
||
|
StatusCode Common Special Cases |
||
|
Before Start of Data |
Bad_NoData |
|
|
After End of Data |
Bad_NoData |
|
|
No Start Bound |
Not Applicable |
|
|
No End Bound |
Not Applicable |
|
|
Bound Bad |
Not Applicable |
|
|
Bound Uncertain |
Not Applicable |
|
The Range Aggregate defined in Table 25 finds the difference between the maximum and minimum Good raw values in the interval. If only one Good value exists in the interval, the range is zero. Note that the range is always zero or positive. If non-Good values are ignored when finding the minimum or maximum values or if Bad values exist then the status is Uncertain_DataSubNormal.
Table 25 – Range Aggregate summary
|
Range Aggregate Characteristics |
||
|
Type |
Calculated |
|
|
Data Type |
Same as Source |
|
|
Use Bounds |
None |
|
|
Timestamp |
StartTime |
|
|
|
||
|
StatusCode Calculations |
||
|
Calculation Method |
Custom If no Bad values then the Status is Good. If Bad values exist then the Status is Uncertain_SubNormal. If an Uncertain value is greater than the maximum or less than the minimum Good value the Status is Uncertain_SubNormal |
|
|
Partial |
Set Sometimes If an interval is not a complete interval |
|
|
Calculated |
Set Always |
|
|
Interpolated |
Not Set |
|
|
Raw |
Not Set |
|
|
Multi Value |
Not Set |
|
|
|
||
|
StatusCode Common Special Cases |
||
|
Before Start of Data |
Bad_NoData |
|
|
After End of Data |
Bad_NoData |
|
|
No Start Bound |
Not Applicable |
|
|
No End Bound |
Not Applicable |
|
|
Bound Bad |
Not Applicable |
|
|
Bound Uncertain |
Not Applicable |
|
The Minimum2 Aggregate defined in Table 26 retrieves the minimum Good value for each interval as defined for Minimum except that Simple Bounding Values are included. The Simple Bounding Values for the interval are found according to the definition of Simple Bounding Values (see 3.1.9). Any Bad values are ignored in the computation. The Aggregate StatusCode will be determined using the StatusCode Calculation (see 5.3) for time based Aggregates. If a bounding value is returned then the status will indicate, Raw, Calculated or Interpolated.
If TreatUncertainAsBad is false and an Uncertain raw value is the minimum then that Uncertain value is used. Uncertain values are ignored otherwise.
If sloped interpolation is used and the End bound is the minimum value then End bound is used as the Minimum with the timestamp set to the startTime of the interval. The End bound is ignored in all other cases.
Table 26 – Minimum2 Aggregate summary
|
Minimum2 Aggregate Characteristics |
||
|
Type |
Calculated |
|
|
Data Type |
Same as Source |
|
|
Use Bounds |
Simple |
|
|
Timestamp |
StartTime |
|
|
|
||
|
StatusCode Calculations |
||
|
Calculation Method |
PercentTime |
|
|
Partial |
Set Sometimes If an interval is not a complete interval |
|
|
Calculated |
Set SometimesSet unless the StartBound is the Minimum |
|
|
Interpolated |
Set Sometimes If an Interpolated bound is the Minimum |
|
|
Raw |
Set Sometimes If a raw value is the Minimum. |
|
|
Multi Value |
Set Sometimes If more than one Good values exist with the same |
|
|
|
||
|
StatusCode Common Special Cases |
||
|
Before Start of Data |
Bad_NoData |
|
|
After End of Data |
Bad_NoData |
|
|
No Start Bound |
Treat the beginning value as Bad_NoData and compute the Aggregate |
|
|
No End Bound |
Treat the ending value as Bad_NoData and compute the Aggregate |
|
|
Bound Bad |
Use as value and compute the Aggregate as defined |
|
|
Bound Uncertain |
Use as value and compute the Aggregate as defined |
|
The Maximum2 Aggregate defined in Table 27 retrieves the maximum Good value for each interval as defined for Maximum except that Simple Bounding Values are included. The Simple Bounding Values for the interval are found according to the definition of Simple Bounding Values (see 3.1.9). Any Bad values are ignored in the computation. The Aggregate StatusCode will be determined using the StatusCode Calculation (see 5.3) for time based Aggregates. If a bounding value is returned then the status will indicate, Raw, Calculated or Interpolated.
If TreatUncertainAsBad is false and an Uncertain raw value is the maximum then that Uncertain value is used. Uncertain values are ignored otherwise.
If sloped interpolation is used and the End bound is the maximum value then End bound is used as the maximum with the timestamp set to the startTime of the interval. The End bound is ignored in all other cases.
Table 27 – Maximum2 Aggregate summary
|
Maximum2 Aggregate Characteristics |
||
|
Type |
Calculated |
|
|
Data Type |
Same as Source |
|
|
Use Bounds |
Simple |
|
|
Timestamp |
StartTime |
|
|
|
||
|
StatusCode Calculations |
||
|
Calculation Method |
PercentTime |
|
|
Partial |
Set Sometimes If an interval is not a complete interval |
|
|
Calculated |
Set Sometimes Set unless the StartBound is the Maximum |
|
|
Interpolated |
Set Sometimes If an Interpolated bound is the Maximum |
|
|
Raw |
Set Sometimes If a raw value is the Maximum. |
|
|
Multi Value |
Set Sometimes If more than one Good values exist with the same |
|
|
|
||
|
StatusCode Common Special Cases |
||
|
Before Start of Data |
Bad_NoData |
|
|
After End of Data |
Bad_NoData |
|
|
No Start Bound |
Treat the beginning value as Bad_NoData and compute the Aggregate |
|
|
No End Bound |
Treat the ending value as Bad_NoData and compute the Aggregate |
|
|
Bound Bad |
Use as value and compute the Aggregate as defined |
|
|
Bound Uncertain |
Use as value and compute the Aggregate as defined |
|
The MinimumActualTime2 Aggregate defined in Table 28 retrieves the minimum Good value for each interval as defined for MinimumActualTime except that Simple Bounding Values are included. The Simple Bounding Values for the interval are found according to the definition of Simple Bounding Values (see 3.1.9). Any Bad values are ignored in the computation. The Aggregate StatusCode will be determined using the StatusCode Calculation (see 5.3) for time based Aggregates. If a bounding value is returned then the status will indicate, Raw, Calculated or Interpolated.
If TreatUncertainAsBad is false and an Uncertain raw value is the minimum then that Uncertain value is used. Uncertain values are ignored otherwise.
If sloped interpolation is used and the End bound is the minimum value then End bound is used as the minimum with the timestamp set to the EffectiveEndTime of the interval. The End bound is ignored in all other cases.
Table 28 – MinimumActualTime2 Aggregate summary
|
MinumumActualTime2 Aggregate Characteristics |
||
|
Type |
Calculated |
|
|
Data Type |
Same as Source |
|
|
Use Bounds |
Simple |
|
|
Timestamp |
Time of minimum |
|
|
|
||
|
StatusCode Calculations |
||
|
Calculation Method |
PercentTime |
|
|
Partial |
Set Sometimes If an interval is not a complete interval |
|
|
Calculated |
Not Set |
|
|
Interpolated |
Set Sometimes If an Interpolated bound is the Minimum |
|
|
Raw |
Set Sometimes If a raw value is the Minimum |
|
|
Multi Value |
Set Sometimes If more than one Good values exist with the same value |
|
|
|
||
|
StatusCode Common Special Cases |
||
|
Before Start of Data |
Bad_NoData |
|
|
After End of Data |
Bad_NoData |
|
|
No Start Bound |
Treat the beginning value as Bad_NoData and compute the Aggregate |
|
|
No End Bound |
Treat the ending value as Bad_NoData and compute the Aggregate |
|
|
Bound Bad |
Use as value and compute the Aggregate as defined |
|
|
Bound Uncertain |
Use as value and compute the Aggregate as defined |
|
The MaximumActualTime2 Aggregate defined in Table 29 retrieves the maximum Good value for each interval as defined for MaximumActualTime except that Simple Bounding Values are included. The Simple Bounding Values for the interval are found according to the definition of Simple Bounding Values (see 3.1.9). Any Bad values are ignored in the computation. The Aggregate StatusCode will be determined using the StatusCode Calculation (see 5.3) for time based Aggregates. If a bounding value is returned then the status will indicate, Raw, Calculated or Interpolated.
If TreatUncertainAsBad is false and an Uncertain raw value is the maximum then that Uncertain value is used. Uncertain values are ignored otherwise.
If sloped interpolation is used and the End bound is the maximum value then End bound is used as the maximum with the timestamp set to the EffectiveEndTime of the interval. The End bound is ignored in all other cases.
Table 29 – MaximumActualTime2 Aggregate summary
|
MaximumActualTime2 Aggregate Characteristics |
||
|
Type |
Calculated |
|
|
Data Type |
Same as Source |
|
|
Use Bounds |
Simple |
|
|
Timestamp |
Time of maximum |
|
|
|
||
|
StatusCode Calculations |
||
|
Calculation Method |
PercentTime |
|
|
Partial |
Set Sometimes If an interval is not a complete interval |
|
|
Calculated |
Not Set |
|
|
Interpolated |
Set Sometimes If an Interpolated bound is the Maximum |
|
|
Raw |
Set Sometimes If a raw value is the Maximum |
|
|
Multi Value |
Set Sometimes If more than one value is equal to the Maximum |
|
|
|
||
|
StatusCode Common Special Cases |
||
|
Before Start of Data |
Bad_NoData |
|
|
After End of Data |
Bad_NoData |
|
|
No Start Bound |
Treat the beginning value as Bad_NoData and compute the Aggregate |
|
|
No End Bound |
Treat the ending value as Bad_NoData and compute the Aggregate |
|
|
Bound Bad |
Use as value and compute the Aggregate as defined |
|
|
Bound Uncertain |
Use as value and compute the Aggregate as defined |
|
The Range2 Aggregate defined in Table 30 finds the difference between the maximum and minimum values in the interval as returned by the Minimum2 and Maximum2 Aggregates. Note that the range is always zero or positive.
Table 30 – Range2 Aggregate summary
|
Range2 Aggregate Characteristics |
||
|
Type |
Calculated |
|
|
Data Type |
Same as Source |
|
|
Use Bounds |
Simple (used in Minimum2 and Maximum2 calculations) |
|
|
Timestamp |
StartTime |
|
|
|
||
|
StatusCode Calculations |
||
|
Calculation Method |
Custom If Minimum2 or Maximum2 are Bad then the status is Bad_NoData. If Minimum2 or Maximum2 are Uncertain then the status is Uncertain_DataSubNormal. Good otherwise |
|
|
Partial |
Set Sometimes If an interval is not a complete interval |
|
|
Calculated |
Set Always |
|
|
Interpolated |
Not Set |
|
|
Raw |
Not Set |
|
|
Multi Value |
Not Set |
|
|
|
||
|
StatusCode Common Special Cases |
||
|
Before Start of Data |
Bad_NoData |
|
|
After End of Data |
Bad_NoData |
|
|
No Start Bound |
Handled by Minimum2 and Maximum2 |
|
|
No End Bound |
Handled by Minimum2 and Maximum2 |
|
|
Bound Bad |
Handled by Minimum2 and Maximum2 |
|
|
Bound Uncertain |
Handled by Minimum2 and Maximum2 |
|
The AnnotationCount Aggregate defined in Table 31 returns a count of all Annotations in the interval.
The StatusCodes are Good, Calculated.
Table 31 – AnnotationCount Aggregate summary
|
AnnotationCount Aggregate Characteristics |
||
|
Type |
Calculated |
|
|
Data Type |
Int32 (negative values are not allowed) |
|
|
Use Bounds |
None |
|
|
Timestamp |
StartTime |
|
|
|
||
|
StatusCode Calculations |
||
|
Calculation Method |
Custom Good unless the interval is before the start of data or after the end of data |
|
|
Partial |
Set Sometimes If an interval is not a complete interval |
|
|
Calculated |
Set Always |
|
|
Interpolated |
Not Set |
|
|
Raw |
Not Set |
|
|
Multi Value |
Not Set |
|
|
|
||
|
StatusCode Common Special Cases |
||
|
Before Start of Data |
Bad_NoData |
|
|
After End of Data |
Bad_NoData |
|
|
No Start Bound |
Does not apply |
|
|
No End Bound |
Does not apply |
|
|
Bound Bad |
Does not apply |
|
|
Bound Uncertain |
Does not apply |
|
The Count Aggregate defined in Table 32 retrieves a count of all the raw values within an interval. If one or more raw values are non-Good, they are not included in the count, and the Aggregate StatusCode is determined using the StatusCode Calculation (see 5.4.3) for non-time based Aggregates. If no Good data exists for an interval, the count is zero.
Unless otherwise indicated, StatusCodes are Good, Calculated.
Table 32 – Count Aggregate summary
|
Count Aggregate Characteristics |
||
|
Type |
Calculated |
|
|
Data Type |
Int32 (negative values are not allowed) |
|
|
Use Bounds |
None |
|
|
Timestamp |
StartTime |
|
|
|
||
|
StatusCode Calculations |
||
|
Calculation Method |
PercentValues |
|
|
Partial |
Set Sometimes If an interval is not a complete interval |
|
|
Calculated |
Set Always |
|
|
Interpolated |
Not Set |
|
|
Raw |
Not Set |
|
|
Multi Value |
Not Set |
|
|
|
||
|
StatusCode Common Special Cases |
||
|
Before Start of Data |
Bad_NoData |
|
|
After End of Data |
Bad_NoData |
|
|
No Start Bound |
Does not apply |
|
|
No End Bound |
Does not apply |
|
|
Bound Bad |
Does not apply |
|
|
Bound Uncertain |
Does not apply |
|
The DurationInStateZero Aggregate defined in Table 33 returns the time Duration during the interval that the Variable was in the zero state. The Simple Bounding Values for the interval are used to determine initial value (start time < end time) or ending value (if start time > end time). If one or more raw values are non-Good, they are not included in the Duration, and the Aggregate StatusCode is determined using the StatusCode Calculation (see 5.3) for time based Aggregates. Duration is in milliseconds. Unless otherwise indicated, StatusCodes are Good, Calculated.
Table 33 – DurationInStateZero Aggregate summary
|
DurationInStateZero Aggregate Characteristics |
||
|
Type |
Calculated |
|
|
Data Type |
Duration |
|
|
Use Bounds |
Simple |
|
|
Timestamp |
StartTime |
|
|
|
||
|
StatusCode Calculations |
||
|
Calculation Method |
PercentTime |
|
|
Partial |
Set Sometimes If an interval is not a complete interval |
|
|
Calculated |
Set Always |
|
|
Interpolated |
Not Set |
|
|
Raw |
Not Set |
|
|
Multi Value |
Not Set |
|
|
|
||
|
StatusCode Common Special Cases |
||
|
Before Start of Data |
Bad_NoData |
|
|
After End of Data |
Bad_NoData |
|
|
No Start Bound |
Treat the beginning value as Bad_NoData and compute the Aggregate |
|
|
No End Bound |
Treat the ending value as Bad_NoData and compute the Aggregate |
|
|
Bound Bad |
Use as value and compute the Aggregate as defined |
|
|
Bound Uncertain |
Use as value and compute the Aggregate as defined |
|
The DurationInStateNonZero Aggregate defined in Table 34 returns the time Duration during the interval that the Variable was in the one state. The Simple Bounding Values for the interval are used to determine initial value (start time < end time) or ending value (if start time > end time). If one or more raw values are non-Good, they are not included in the Duration, and the Aggregate StatusCode is determined using the StatusCode Calculation (see 5.3) for time based Aggregates.
Duration is in milliseconds. Unless otherwise indicated, StatusCodes are Good, Calculated.
Table 34 – DurationInStateNonZero Aggregate summary
|
DurationInStateNonZero Aggregate Characteristics |
||
|
Type |
Calculated |
|
|
Data Type |
Duration |
|
|
Use Bounds |
Simple |
|
|
Timestamp |
StartTime |
|
|
|
||
|
StatusCode Calculations |
||
|
Calculation Method |
PercentTime |
|
|
Partial |
Set Sometimes If an interval is not a complete interval |
|
|
Calculated |
Set Always |
|
|
Interpolated |
Not Set |
|
|
Raw |
Not Set |
|
|
Multi Value |
Not Set |
|
|
|
||
|
StatusCode Common Special Cases |
||
|
Before Start of Data |
Bad_NoData |
|
|
After End of Data |
Bad_NoData |
|
|
No Start Bound |
Treat the beginning value as Bad_NoData and compute the Aggregate |
|
|
No End Bound |
Treat the ending value as Bad_NoData and compute the Aggregate |
|
|
Bound Bad |
Use as value and compute the Aggregate as defined |
|
|
Bound Uncertain |
Use as value and compute the Aggregate as defined |
|
The NumberOfTransitions Aggregate defined in Table 35 returns a count of the number of transition the Variable had during the interval. If one or more raw values are Bad, they are not included in the count, and the Aggregate StatusCode is determined using the StatusCode Calculation (see 5.3) for non-time based Aggregates.
The earliest transition shall be calculated by comparing the earliest non-Bad value in the interval to the previous non-Bad value. A transition occurred if no previous non-Bad value exists or if the earliest non-Bad value is different. The endTime is not considered part of the interval, so a transition occurring at the endTime is not included.
Unless otherwise indicated, StatusCodes are Good, Calculated.
Table 35 – NumberOfTransitions Aggregate summary
|
NumberOfTransitions Aggregate Characteristics |
||
|
Type |
Calculated |
|
|
Data Type |
Int32 (negative values are not allowed) |
|
|
Use Bounds |
Custom, a non-Bad value prior to the interval is used |
|
|
Timestamp |
StartTime |
|
|
|
||
|
StatusCode Calculations |
||
|
Calculation Method |
PercentValues |
|
|
Partial |
Set Sometimes If an interval is not a complete interval |
|
|
Calculated |
Set Always |
|
|
Interpolated |
Not Set |
|
|
Raw |
Not Set |
|
|
Multi Value |
Not Set |
|
|
|
||
|
|
||
|
StatusCode Common Special Cases |
||
|
Before Start of Data |
Bad_NoData |
|
|
After End of Data |
Bad_NoData |
|
|
No Start Bound |
Treat the beginning value as Bad_NoData and compute the Aggregate |
|
|
No End Bound |
Treat the ending value as Bad_NoData and compute the Aggregate |
|
|
Bound Bad |
Use as value and compute the Aggregate as defined |
|
|
Bound Uncertain |
Use as value and compute the Aggregate as defined |
|
The Start Aggregate defined in Table 36 retrieves the earliest raw value within the interval, and returns that value and status with the timestamp at which that value occurs. If no values are in the interval then the StatusCode is Bad_NoData.
Table 36 – Start Aggregate summary
|
Start Aggregate Characteristics |
||
|
Type |
Calculated |
|
|
Data Type |
Same as Source |
|
|
Use Bounds |
None |
|
|
Timestamp |
Time of Raw Value |
|
|
|
||
|
StatusCode Calculations |
||
|
Calculation Method |
Custom The raw value status is returned |
|
|
Partial |
Set Sometimes If an interval is not a complete interval |
|
|
Calculated |
Not Set |
|
|
Interpolated |
Not Set |
|
|
Raw |
Always |
|
|
Multi Value |
Not Set |
|
|
|
||
|
StatusCode Common Special Cases |
||
|
Before Start of Data |
Bad_NoData |
|
|
After End of Data |
Bad_NoData |
|
|
No Start Bound |
Does not apply |
|
|
No End Bound |
Does not apply |
|
|
Bound Bad |
Does not apply |
|
|
Bound Uncertain |
Does not apply |
|
The End Aggregate defined in Table 37 retrieves the latest raw value within the interval, and returns that value and status with the timestamp at which that value occurs. If no values are in the interval then the StatusCode is Bad_NoData.
Table 37 – End Aggregate summary
|
End Aggregate Characteristics |
||
|
Type |
Calculated |
|
|
Data Type |
Same as Source |
|
|
Use Bounds |
None |
|
|
Timestamp |
Time of Raw Value |
|
|
|
||
|
StatusCode Calculations |
||
|
Calculation Method |
Custom The raw value status is returned |
|
|
Partial |
Set Sometimes If an interval is not a complete interval |
|
|
Calculated |
Not Set |
|
|
Interpolated |
Not Set |
|
|
Raw |
Always |
|
|
Multi Value |
Not Set |
|
|
|
||
|
StatusCode Common Special Cases |
||
|
Before Start of Data |
Bad_NoData |
|
|
After End of Data |
Bad_NoData |
|
|
No Start Bound |
Does not apply |
|
|
No End Bound |
Does not apply |
|
|
Bound Bad |
Does not apply |
|
|
Bound Uncertain |
Does not apply |
|
The Delta Aggregate defined in Table 38 retrieves the difference between the earliest and latest Good raw values in the interval. The Aggregate is negative if the latest value is less than the earliest value. The status is Uncertain_DataSubNormal if non-Good values are skipped while looking for the first or last values. The status is Good otherwise. The status is Bad_NoData if no Good raw values exist.
Table 38 – Delta Aggregate summary
|
Delta Aggregate Characteristics |
||
|
Type |
Calculated |
|
|
Data Type |
Same as Source |
|
|
Use Bounds |
None |
|
|
Timestamp |
StartTime |
|
|
|
||
|
StatusCode Calculations |
||
|
Calculation Method |
Custom Uncertain_DataSubNormal if non-Good values are skipped while looking for the first or last values |
|
|
Partial |
Set Sometimes If an interval is not a complete interval |
|
|
Calculated |
Set Always
|
|
|
Interpolated |
Not Set |
|
|
Raw |
Not Set |
|
|
Multi Value |
Not Set |
|
|
|
||
|
StatusCode Common Special Cases |
||
|
Before Start of Data |
Bad_NoData |
|
|
After End of Data |
Bad_NoData |
|
|
No Start Bound |
Does not apply |
|
|
No End Bound |
Does not apply |
|
|
Bound Bad |
Does not apply |
|
|
Bound Uncertain |
Does not apply |
|
The StartBound Aggregate defined in Table 39 returns the value and status at the StartTime for the interval by calculating the Simple Bounding Values for the interval (see 3.1.9).
Table 39 – StartBound Aggregate summary
|
StartBound Aggregate Characteristics |
||
|
Type |
Calculated |
|
|
Data Type |
Same as Source |
|
|
Use Bounds |
Simple |
|
|
Timestamp |
StartTime |
|
|
|
||
|
StatusCode Calculations |
||
|
Calculation Method |
Custom The status of the start bound. |
|
|
Partial |
Set Sometimes If an interval is not a complete interval |
|
|
Calculated |
Not Set |
|
|
Interpolated |
Set Sometimes If the bound is interpolated |
|
|
Raw |
Set Sometimes If a value exists at the start time |
|
|
Multi Value |
Not Set |
|
|
|
||
|
StatusCode Common Special Cases |
||
|
Before Start of Data |
Bad_NoData |
|
|
After End of Data |
Bad_NoData |
|
|
No Start Bound |
Bad_NoData |
|
|
No End Bound |
Does not apply |
|
|
Bound Bad |
Same as bound |
|
|
Bound Uncertain |
Same as bound |
|
The EndBound Aggregate defined in Table 40 returns the value and status at the EndTime for the interval by calculating the Simple Bounding Values for the interval (see 3.1.9).
The timestamp returned is always the start of the interval and Calculated bit is set.
Table 40 – EndBound Aggregate summary
|
EndBound Aggregate Characteristics |
||
|
Type |
Calculated |
|
|
Data Type |
Same as Source |
|
|
Use Bounds |
Simple |
|
|
Timestamp |
StartTime |
|
|
|
||
|
StatusCode Calculations |
||
|
Calculation Method |
Custom The status of the end bound. |
|
|
Partial |
Set Sometimes If an interval is not a complete interval |
|
|
Calculated |
Set Always |
|
|
Interpolated |
Not Set |
|
|
Raw |
Not Set |
|
|
Multi Value |
Not Set |
|
|
|
||
|
StatusCode Common Special Cases |
||
|
Before Start of Data |
Bad_NoData |
|
|
After End of Data |
Bad_NoData |
|
|
No Start Bound |
Does not apply |
|
|
No End Bound |
Bad_NoData |
|
|
Bound Bad |
Same as bound |
|
|
Bound Uncertain |
Same as bound |
|
The DeltaBounds Aggregate defined in Table 41 returns the difference between the StartBound and the EndBound Aggregates with the exception that both the start and end shall be Good. If the end value is less than the start value, the result will be negative. If the end value is the same as the start value the result will be zero. If the end value is greater than the start value, the result will be positive. If one or both values are Bad the return status will be Bad_NoData. If one or both values are Uncertain the status will be Uncertain_DataSubNormal.
Table 41 – DeltaBounds Aggregate summary
|
DeltaBounds Aggregate Characteristics |
||
|
Type |
Calculated |
|
|
Data Type |
Same as Source |
|
|
Use Bounds |
Simple |
|
|
Timestamp |
StartTime |
|
|
|
||
|
StatusCode Calculations |
||
|
Calculation Method |
Custom Good if both bounds are Good Uncertain_DataSubNormal if either bound is uncertain Bad_NoData if either bound is Bad |
|
|
Partial |
Set Sometimes If an interval is not a complete interval |
|
|
Calculated |
Set Always |
|
|
Interpolated |
Not Set |
|
|
Raw |
Not Set |
|
|
Multi Value |
Not Set |
|
|
|
||
|
StatusCode Common Special Cases |
||
|
Before Start of Data |
Bad_NoData |
|
|
After End of Data |
Bad_NoData |
|
|
No Start Bound |
Bad_NoData |
|
|
No End Bound |
Bad_NoData |
|
|
Bound Bad |
Bad_NoData |
|
|
Bound Uncertain |
Uncertain_DataSubNormal |
|
The DurationGood Aggregate defined in Table 42 divides the interval into regions of Good and non-Good data. Each region starts with a data point in the interval. If that data point is Good the region is Good. The Aggregate is the sum of the duration of all Good regions expressed in milliseconds.
The status of the first region is determined by finding the first data point at or before the start of the interval. If no value exists, the first region is Bad.
Each Aggregate is returned with timestamp of the start of the interval. StatusCodes are Good, Calculated.
Table 42 – DurationGood Aggregate summary
|
DurationGood Aggregate Characteristics |
||
|
Type |
Calculated |
|
|
Data Type |
Duration |
|
|
Use Bounds |
Uses status of bounding value |
|
|
Timestamp |
StartTime |
|
|
|
||
|
StatusCode Calculations |
||
|
Calculation Method |
Custom StatusCode is always Good, Calculated |
|
|
Partial |
Set Sometimes If an interval is not a complete interval |
|
|
Calculated |
Set Always |
|
|
Interpolated |
Not Set |
|
|
Raw |
Not Set |
|
|
Multi Value |
Not Set |
|
|
|
||
|
StatusCode Common Special Cases |
||
|
Before Start of Data |
Bad_NoData |
|
|
After End of Data |
Bad_NoData |
|
|
No Start Bound |
No special handing required |
|
|
No End Bound |
No special handing required |
|
|
Bound Bad |
No special handing required |
|
|
Bound Uncertain |
No special handing required |
|
The DurationBad Aggregate defined in Table 43 divides the interval into regions of Bad and non-Bad data. Each region starts with a data point in the interval. If that data point is Bad the region is Bad. The Aggregate is the sum of the duration of all Bad regions expressed in milliseconds.
The status of the first region is determined by finding the first data point at or before the start of the interval. If no value exists, the first region is Bad.
Each Aggregate is returned with timestamp of the start of the interval. StatusCodes are Good, Calculated.
Table 43 – DurationBad Aggregate summary
|
DurationBad Aggregate Characteristics |
||
|
Type |
Calculated |
|
|
Data Type |
Duration |
|
|
Use Bounds |
Uses status of bounding value |
|
|
Timestamp |
StartTime |
|
|
|
||
|
StatusCode Calculations |
||
|
Calculation Method |
Custom StatusCode is always Good, Calculated |
|
|
Partial |
Set Sometimes If an interval is not a complete interval |
|
|
Calculated |
Set Always |
|
|
Interpolated |
Not Set |
|
|
Raw |
Not Set |
|
|
Multi Value |
Not Set |
|
|
|
||
|
StatusCode Common Special Cases |
||
|
Before Start of Data |
Bad_NoData |
|
|
After End of Data |
Bad_NoData |
|
|
No Start Bound |
No special handing required |
|
|
No End Bound |
No special handing required |
|
|
Bound Bad |
No special handing required |
|
|
Bound Uncertain |
No special handing required |
|
The PercentGood Aggregate defined in Table 44 performs the following calculation:
PercentGood = DurationGood / ProcessingInterval x 100
where:
DurationGood is the result from the DurationGood Aggregate, calculated using the ProcessingInterval supplied to PercentGood call.
ProcessingInterval is the duration of interval.
If the last interval is a partial interval then the duration of the partial interval is used in the calculation. Each Aggregate is returned with timestamp of the start of the interval. StatusCodes are Good, Calculated.
Table 44 – PercentGood Aggregate summary
|
PercentGood Aggregate Characteristics |
||
|
Type |
Calculated |
|
|
Data Type |
Double (percent) |
|
|
Use Bounds |
Simple (used in DurationGood calculation) |
|
|
Timestamp |
StartTime |
|
|
|
||
|
StatusCode Calculations |
||
|
Calculation Method |
Custom Always Good |
|
|
Partial |
Set Sometimes If an interval is not a complete interval |
|
|
Calculated |
Set Always |
|
|
Interpolated |
Not Set |
|
|
Raw |
Not Set |
|
|
Multi Value |
Not Set |
|
|
|
||
|
StatusCode Common Special Cases |
||
|
Before Start of Data |
Bad_NoData |
|
|
After End of Data |
Bad_NoData |
|
|
No Start Bound |
No special handing required |
|
|
No End Bound |
No special handing required |
|
|
Bound Bad |
No special handing required |
|
|
Bound Uncertain |
No special handing required |
|
The PercentBad Aggregate defined in Table 45 performs the following calculation:
PercentBad = DurationBad / ProcessingInterval x 100
where:
DurationBad is the result from the DurationBad Aggregate, calculated using the ProcessingInterval supplied to PercentBad call.
ProcessingInterval is the duration of interval.
If the last interval is a partial interval then the duration of the partial interval is used in the calculation. Each Aggregate is returned with timestamp of the start of the interval. StatusCodes are Good, Calculated.
Table 45 – PercentBad Aggregate summary
|
PercentBad Aggregate Characteristics |
||
|
Type |
Calculated |
|
|
Data Type |
Double (percent) |
|
|
Use Bounds |
Simple (used in DurationBad calculation) |
|
|
Timestamp |
StartTime |
|
|
|
||
|
StatusCode Calculations |
||
|
Calculation Method |
Custom Always Good. |
|
|
Partial |
Set Sometimes If an interval is not a complete interval |
|
|
Calculated |
Set Always |
|
|
Interpolated |
Not Set |
|
|
Raw |
Not Set |
|
|
Multi Value |
Not Set |
|
|
|
||
|
StatusCode Common Special Cases |
||
|
Before Start of Data |
Bad_NoData |
|
|
After End of Data |
Bad_NoData |
|
|
No Start Bound |
No special handing required |
|
|
No End Bound |
No special handing required |
|
|
Bound Bad |
No special handing required |
|
|
Bound Uncertain |
No special handing required |
|
The WorstQuality Aggregate defined in Table 46 returns the worst status of the raw values in the interval where a Bad status is worse than Uncertain, which is worse than Good. No distinction is made between the specific reasons for the status. The server shall ignore the TreatUncertainAsBad for this aggregate.
If multiple values exist with the worst quality the MultipleValues bit is set. If multiple values exist with the worst quality but different StatusCodes then the StatusCode of the first value is returned.
This Aggregate returns the worst StatusCode as the value of the Aggregate.
The timestamp is always the start of the interval. The StatusCodes are Good, Calculated.
Table 46 – WorstQuality Aggregate summary
|
WorstQuality Aggregate Characteristics |
||
|
Type |
Calculated |
|
|
Data Type |
StatusCode |
|
|
Use Bounds |
None |
|
|
Timestamp |
StartTime |
|
|
|
||
|
StatusCode Calculations |
||
|
Calculation Method |
Custom Always Good |
|
|
Partial |
Set Sometimes If an interval is not a complete interval |
|
|
Calculated |
Set Always |
|
|
Interpolated |
Not Set |
|
|
Raw |
Not Set |
|
|
Multi Value |
Used |
|
|
|
||
|
StatusCode Common Special Cases |
||
|
Before Start of Data |
Bad_NoData |
|
|
After End of Data |
Bad_NoData |
|
|
No Start Bound |
No special handing required |
|
|
No End Bound |
No special handing required |
|
|
Bound Bad |
No special handing required |
|
|
Bound Uncertain |
No special handing required |
|
The WorstQuality2 Aggregate defined in Table 47 returns the worst status of the raw values in the interval where a Bad status is worse than Uncertain, which is worse than Good. No distinction is made between the specific reasons for the status. The server shall ignore the TreatUncertainAsBad for this aggregate.
The start bound calculated using Simple Bounding Values (see 3.1.9) is always included when determining the worst quality.
If multiple values exist with the worst quality the MultipleValues bit is set. If multiple values exist with the worst quality but different StatusCodes then the StatusCode of the first value is returned.
This Aggregate returns the worst StatusCode as the value of the Aggregate.
The timestamp is always the start of the interval. The StatusCodes are Good, Calculated.
Table 47 – WorstQuality2 Aggregate summary
|
WorstQuality2 Aggregate Characteristics |
||
|
Type |
Calculated |
|
|
Data Type |
StatusCode |
|
|
Use Bounds |
Simple |
|
|
Timestamp |
StartTime |
|
|
|
||
|
StatusCode Calculations |
||
|
Calculation Method |
Custom Always Good |
|
|
Partial |
Set Sometimes If an interval is not a complete interval |
|
|
Calculated |
Set Always |
|
|
Interpolated |
Not Set |
|
|
Raw |
Not Set |
|
|
Multi Value |
Used |
|
|
|
||
|
StatusCode Common Special Cases |
||
|
Before Start of Data |
Bad_NoData |
|
|
After End of Data |
Bad_NoData |
|
|
No Start Bound |
No special handing required |
|
|
No End Bound |
No special handing required |
|
|
Bound Bad |
No special handing required |
|
|
Bound Uncertain |
No special handing required |
|
The StandardDeviationSample Aggregate defined in Table 48 uses the formula:
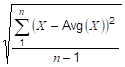
where X is each Good raw value in the interval, Avg(X) is the average of the Good raw values, and n is the number of Good raw values in the interval.
For every interval where n = 1, a value of 0 is returned.
If any non-Good values were ignored, the Aggregate quality is uncertain/subnormal.
All interval Aggregates return timestamp of the start of the interval. Unless otherwise indicated, qualities are Good, Calculated.
This calculation is for a sample population where the calculation is done on a subset of the full set of data. Use StandardDeviationPopulation to calculate the standard deviation of a full set of data (see 5.4.3.39). An example would be when the underlying data is sampled from the data source versus stored on an exception basis.
Table 48 – StandardDeviationSample Aggregate summary
|
StandardDeviationSample Aggregate Characteristics |
||
|
Type |
Calculated |
|
|
Data Type |
Double |
|
|
Use Bounds |
None |
|
|
Timestamp |
StartTime |
|
|
|
||
|
StatusCode Calculations |
||
|
Calculation Method |
Custom Always Good |
|
|
Partial |
Set Sometimes If an interval is not a complete interval |
|
|
Calculated |
Set Always |
|
|
Interpolated |
Not Set |
|
|
Raw |
Not Set |
|
|
Multi Value |
Not Set |
|
|
|
||
|
StatusCode Common Special Cases |
||
|
Before Start of Data |
Bad_NoData |
|
|
After End of Data |
Bad_NoData |
|
|
No Start Bound |
No special handing required |
|
|
No End Bound |
No special handing required |
|
|
Bound Bad |
No special handing required |
|
|
Bound Uncertain |
No special handing required |
|
|
Conformance Units |
||
|
Aggregates StandardDeviationSample |
||
The VarianceSample Aggregate defined in Table 49 retrieves the square of the standard deviation. Its behaviour is the same as the StandardDeviationSample Aggregate. Unless otherwise indicated, qualities are Good, Calculated.
This calculation is for a sample population where the calculation is done on a subset of the full population. Use VariancePopulation to calculate the variance of a full set of data (5.4.3.40).
Table 49 – VarianceSample Aggregate summary
|
VarianceSample Aggregate Characteristics |
||
|
Type |
Calculated |
|
|
Data Type |
Double |
|
|
Use Bounds |
None |
|
|
Timestamp |
StartTime |
|
|
|
||
|
StatusCode Calculations |
||
|
Calculation Method |
Custom Always Good |
|
|
Partial |
Set Sometimes If an interval is not a complete interval |
|
|
Calculated |
Set Always |
|
|
Interpolated |
Not Set |
|
|
Raw |
Not Set |
|
|
Multi Value |
Not Set |
|
|
|
||
|
StatusCode Common Special Cases |
||
|
Before Start of Data |
Bad_NoData |
|
|
After End of Data |
Bad_NoData |
|
|
No Start Bound |
No special handing required |
|
|
No End Bound |
No special handing required |
|
|
Bound Bad |
No special handing required |
|
|
Bound Uncertain |
No special handing required |
|
The StandardDeviationPopulation Aggregate defined in Table 50 uses the formula:
where X is each Good raw value in the interval, Avg(X) is the average of the Good raw values, and n is the number of Good raw values in the interval.
For every interval where n = 1, a value of 0 is returned.
If any non-Good values were ignored, the Aggregate quality is uncertain/subnormal.
All interval Aggregates return timestamp of the start of the interval. Unless otherwise indicated, qualities are Good, Calculated.
This calculation is for a full population where the calculation is done on the full set of data. Use StandardDeviationSample to calculate the standard deviation of a subset of the full population (5.4.3.37). An example would be when the underlying data is collected on an exception basis versus sampled from the data source.
Table 50 – StandardDeviationPopulation Aggregate summary
|
StandardDeviationPopulation Aggregate Characteristics |
||
|
Type |
Calculated |
|
|
Data Type |
Double |
|
|
Use Bounds |
None |
|
|
Timestamp |
StartTime |
|
|
|
||
|
StatusCode Calculations |
||
|
Calculation Method |
Custom Always Good |
|
|
Partial |
Set Sometimes If an interval is not a complete interval |
|
|
Calculated |
Set Always |
|
|
Interpolated |
Not Set |
|
|
Raw |
Not Set |
|
|
Multi Value |
Not Set |
|
|
|
||
|
StatusCode Common Special Cases |
||
|
Before Start of Data |
Bad_NoData |
|
|
After End of Data |
Bad_NoData |
|
|
No Start Bound |
No special handing required |
|
|
No End Bound |
No special handing required |
|
|
Bound Bad |
No special handing required |
|
|
Bound Uncertain |
No special handing required |
|
The VariancePopulation Aggregate defined in Table 51 retrieves the square of the standard deviation. Its behaviour is the same as the StandardDeviationPopulation Aggregate. Unless otherwise indicated, qualities are Good, Calculated.
This calculation is for a full population where the calculation is done on the full set of data. Use VarianceSample to calculate the variance of a subset of the full population (5.4.3.38).
Table 51 – VariancePopulation Aggregate summary
|
VariancePopulation Aggregate Characteristics |
||
|
Type |
Calculated |
|
|
Data Type |
Double |
|
|
Use Bounds |
None |
|
|
Timestamp |
StartTime |
|
|
|
||
|
StatusCode Calculations |
||
|
Calculation Method |
Custom Always Good |
|
|
Partial |
Set Sometimes If an interval is not a complete interval |
|
|
Calculated |
Set Always |
|
|
Interpolated |
Not Set |
|
|
Raw |
Not Set |
|
|
Multi Value |
Not Set |
|
|
|
||
|
StatusCode Common Special Cases |
||
|
Before Start of Data |
Bad_NoData |
|
|
After End of Data |
Bad_NoData |
|
|
No Start Bound |
No special handing required |
|
|
No End Bound |
No special handing required |
|
|
Bound Bad |
No special handing required |
|
|
Bound Uncertain |
No special handing required |
|
Annex A
(informative)
The Aggregate examples are produced programatically with the resulting output as a CSV file.
The CSV file released with this version of the standard can be found here:
http://www.opcfoundation.org/UA/schemas/1.05/AggregateExamples.csv
NOTE The latest CSV that is compatible with this version of the standard can be found here:
http://www.opcfoundation.org/UA/schemas/AggregateExamples.csv
________